Imagine trying to understand the shape of a landscape just by looking at a flat piece of paper or 2D screen image. Without the right information, you'd miss the hidden hills, steep slopes, and gentle valleys that define every property.
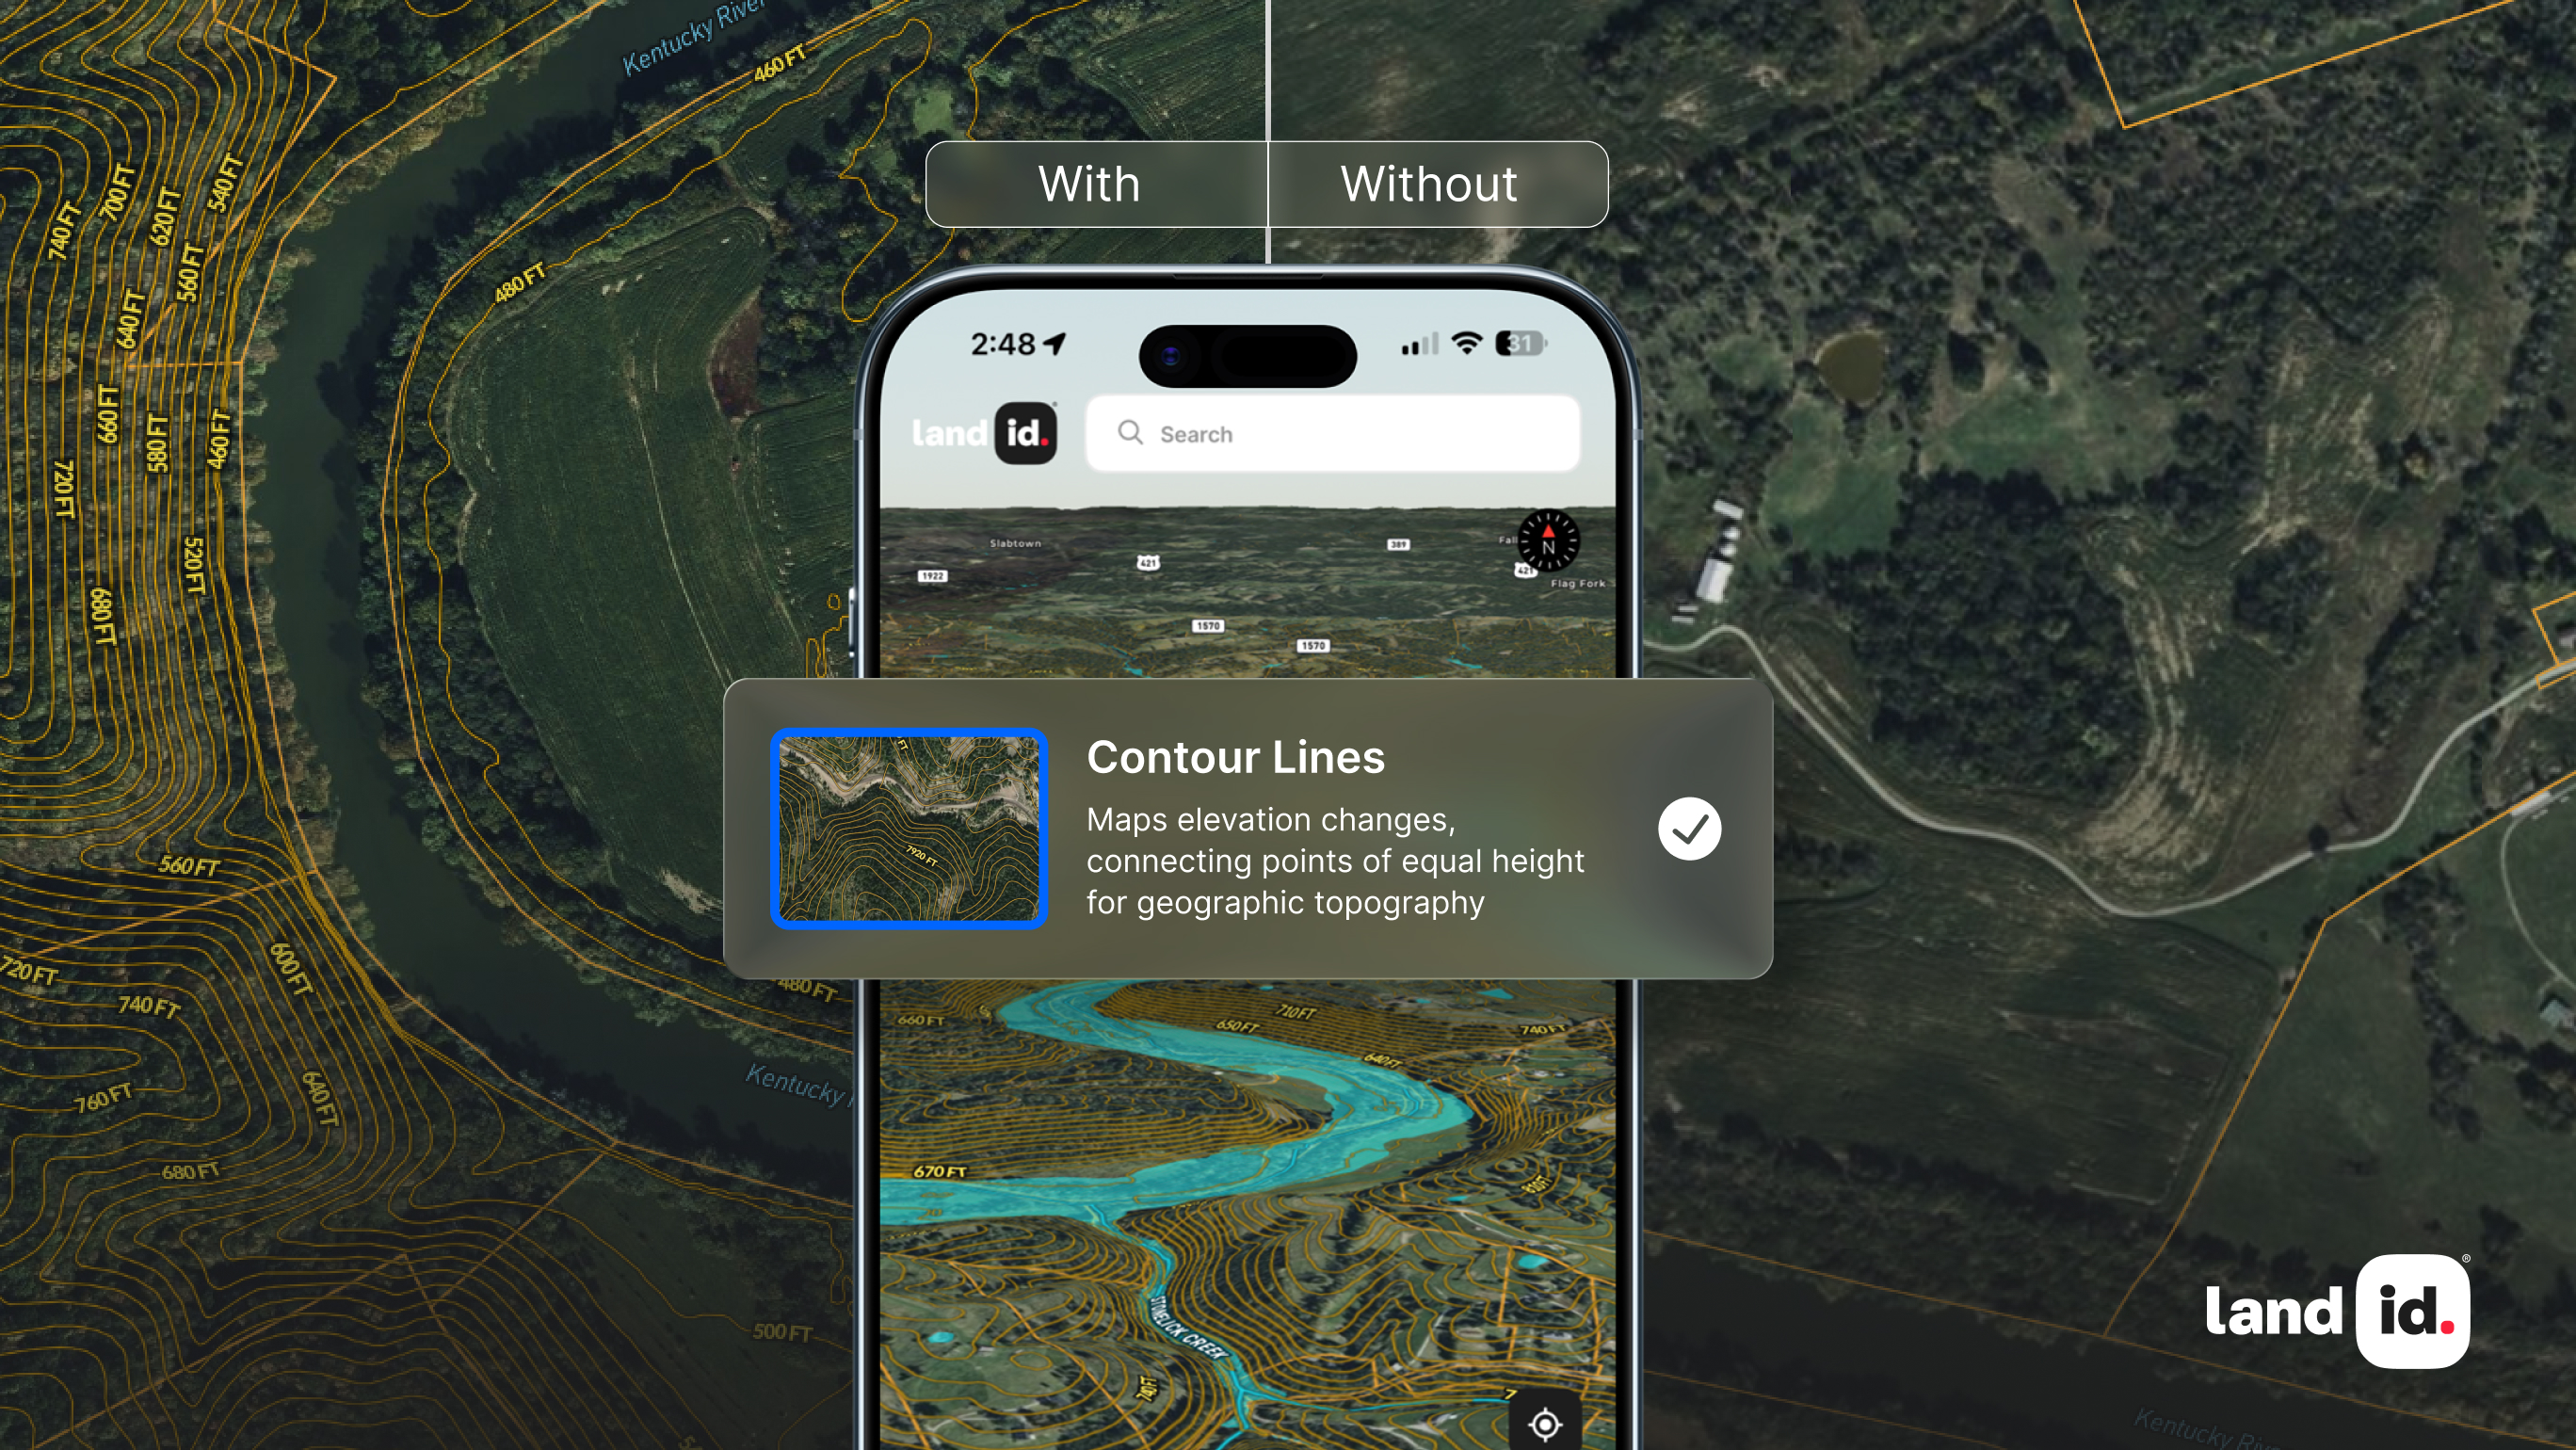
That's where contour lines come in. These powerful map features reveal the secrets of elevation and terrain, turning a simple map into a three-dimensional story. In Land id, contour lines are an available map overlay that can help you uncover a property’s potential and limitations.
Whether you're planning a development project, buying land, or just curious about what's under your feet, learning how to read contour lines is the key to unlocking the land's true identity and potential.
Main Takeaways
- Contour lines connect points of equal elevation to visualize three-dimensional terrain on two-dimensional maps.
- The spacing between contour lines indicates slope steepness: close lines show steep terrain, distant lines show gentle slopes.
- Contour intervals tell you the vertical distance between adjacent lines.
- The Contour Lines Overlay in Land id helps you identify landforms, evaluate property, and make informed land management decisions.
What Are Contour Lines?
Contour lines are lines drawn on a map that connect points of equal elevation above sea level. They allow two-dimensional maps to represent three-dimensional terrain, showing the shape, height, and features of the land.
Each contour line represents a specific elevation. If you were to walk along one in real life, you would stay at the same height without ascending or descending. These lines are fundamental to topographic maps and help visualize landforms such as mountains, valleys, ridges, and plateaus.
Contour lines follow consistent rules that make them reliable for terrain analysis:
- Equal elevation: Every point along the line is at the same height.
- Consistent intervals: The vertical distance between lines—known as the contour interval—remains the same throughout the map.
- Closed loops: All contour lines eventually form closed shapes, though some may run off the map’s edge.
- No crossings: Contour lines never intersect, except in rare cases like overhanging cliffs.
- Directional clues: V-shaped lines typically indicate valleys or drainage paths, pointing upstream. On ridges, they point downhill.
Why Contour Lines Matter in Property Analysis
Before diving into how contour lines are created, it's worth understanding why they're so important in the first place.
Contour lines give property professionals, developers, and landowners a clear view of elevation and terrain—insights that are often invisible from street-level views or satellite imagery alone. This elevation context can affect everything from construction costs and drainage to long-term land value.
When reviewing property for development, sale, or conservation, contour lines help answer key questions:
- Is the site buildable without major grading?
- Will water drain safely away from structures?
- Are there access challenges due to steep terrain?
- What parts of the property offer the best views or privacy?
From initial feasibility studies to final design plans, contour lines support informed decision-making and help prevent costly mistakes. Whether you're analyzing raw land or evaluating a built environment, understanding the shape of the terrain is fundamental, and contour lines are how that shape gets revealed.
How Are Contour Lines Created Today?
Modern contour lines are created using sophisticated digital tools and data collection methods that have largely replaced traditional surveying techniques.
Digital Elevation Models (DEMs)
Digital Elevation Models form the foundation of modern contour mapping. These computer-based representations of terrain are created using:
- LiDAR scanning: Aircraft-mounted lasers measure ground elevation with centimeter-level accuracy
- Satellite imagery: Specialized satellites capture elevation data across vast areas
- Photogrammetry: Overlapping aerial photographs are analyzed to determine height differences
DEMs store elevation data as a grid of points, each with precise coordinates and height values. This digital format allows for rapid analysis and visualization of terrain.
Automated Software Tools
GIS software transforms raw elevation data into usable contour lines through automated processes:
- Contour generation algorithms: Software analyzes elevation points and connects those with equal values
- Smoothing functions: Raw contour lines are refined to remove anomalies while preserving important terrain features
- Custom interval selection: Users can specify the vertical distance between contour lines based on their needs
The digital creation process allows for dynamic visualization of contour lines on topographic maps at different scales and intervals. This flexibility makes modern contour mapping more versatile than traditional paper maps.
How to Read & Interpret Contour Lines
Learning to interpret contour lines unlocks valuable insights about the land. Here's how to read what contour lines on maps are telling you:
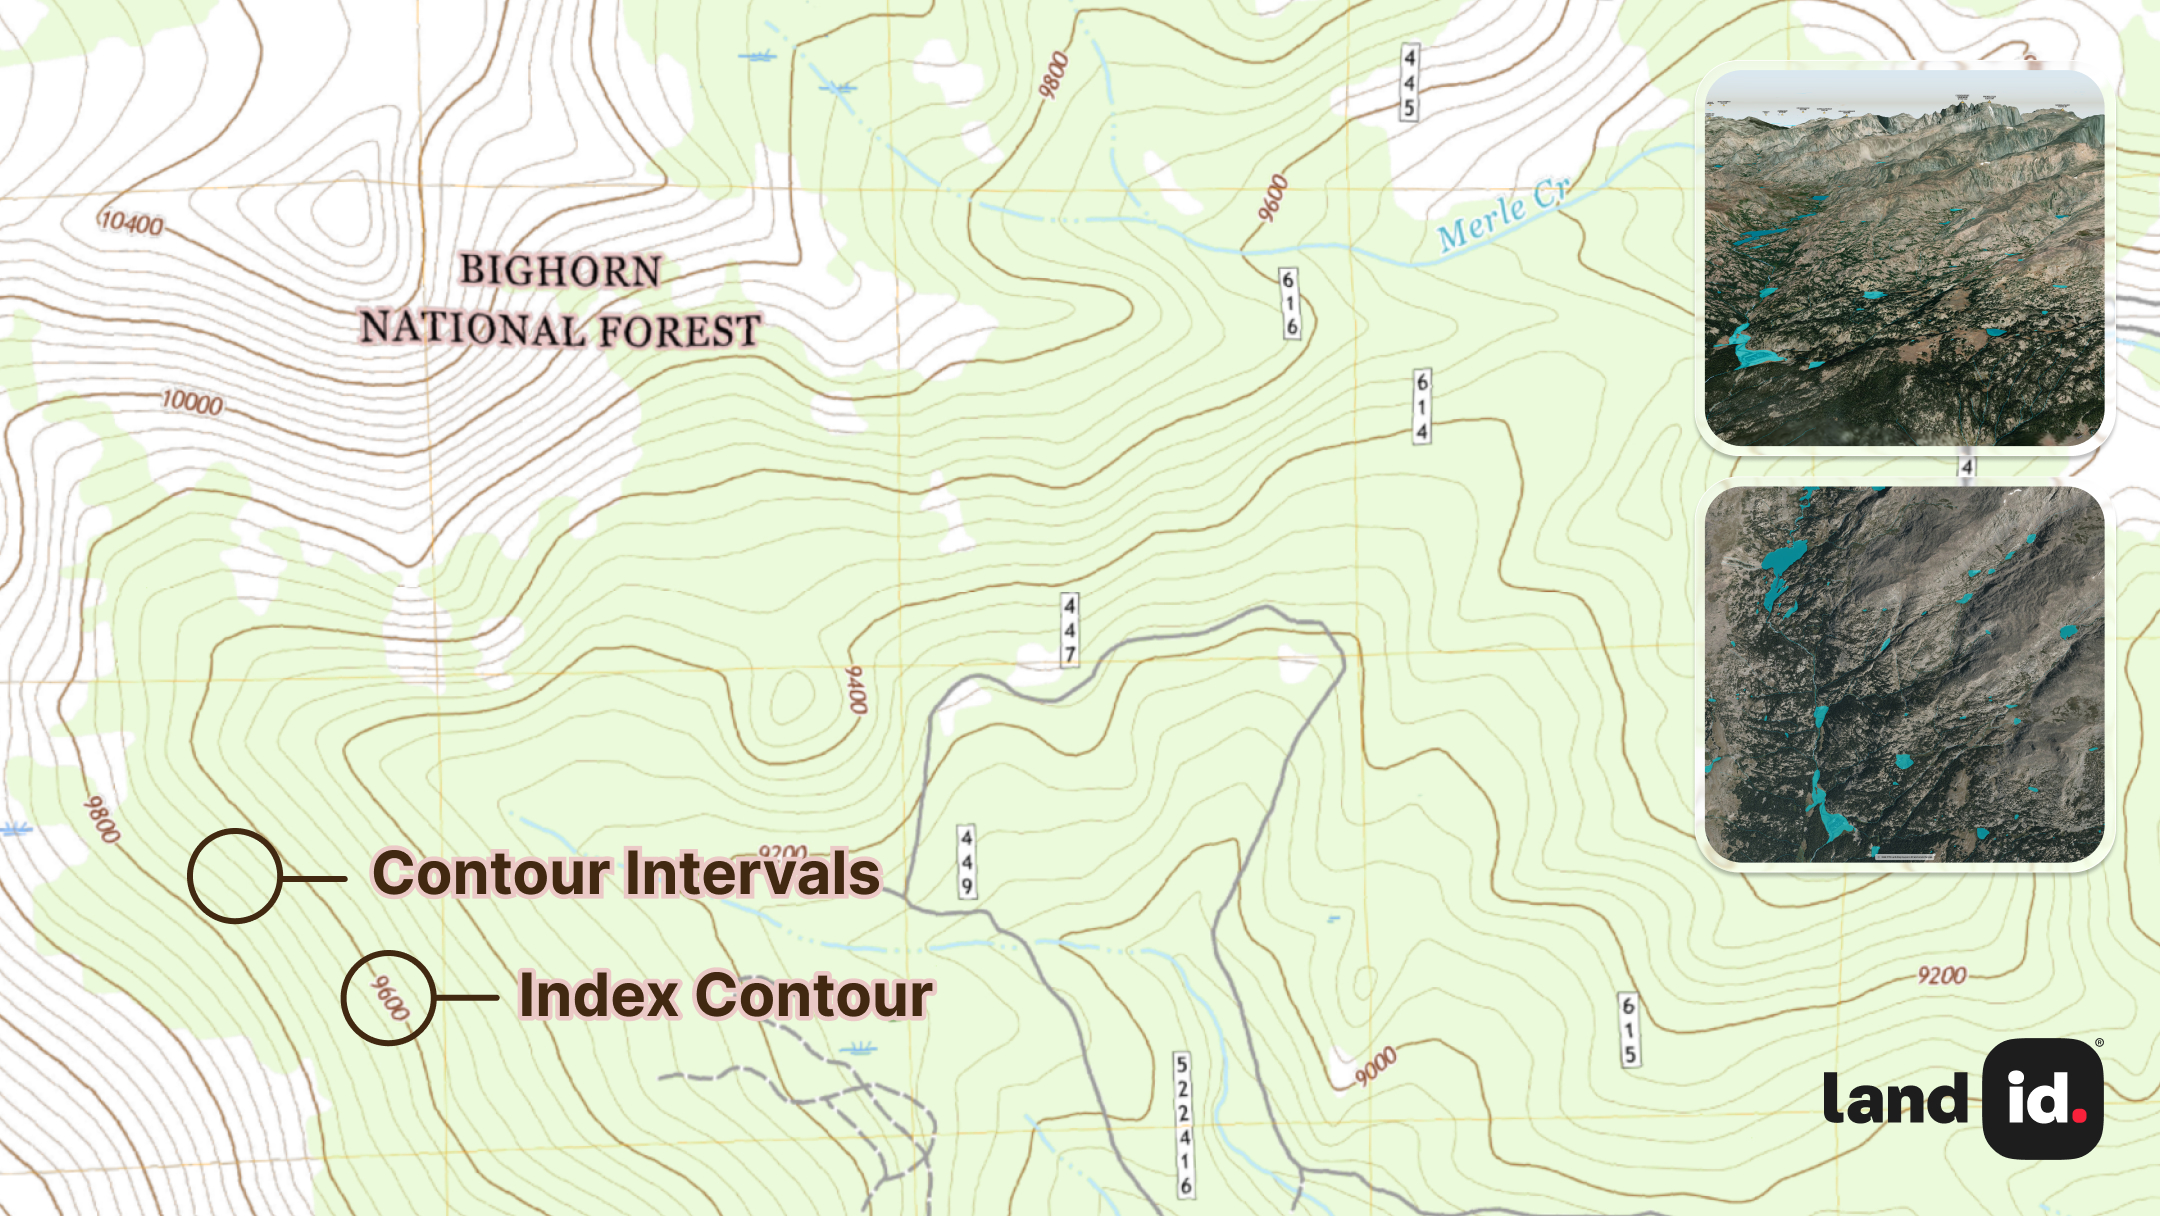
Understand Contour Intervals & Map Scale
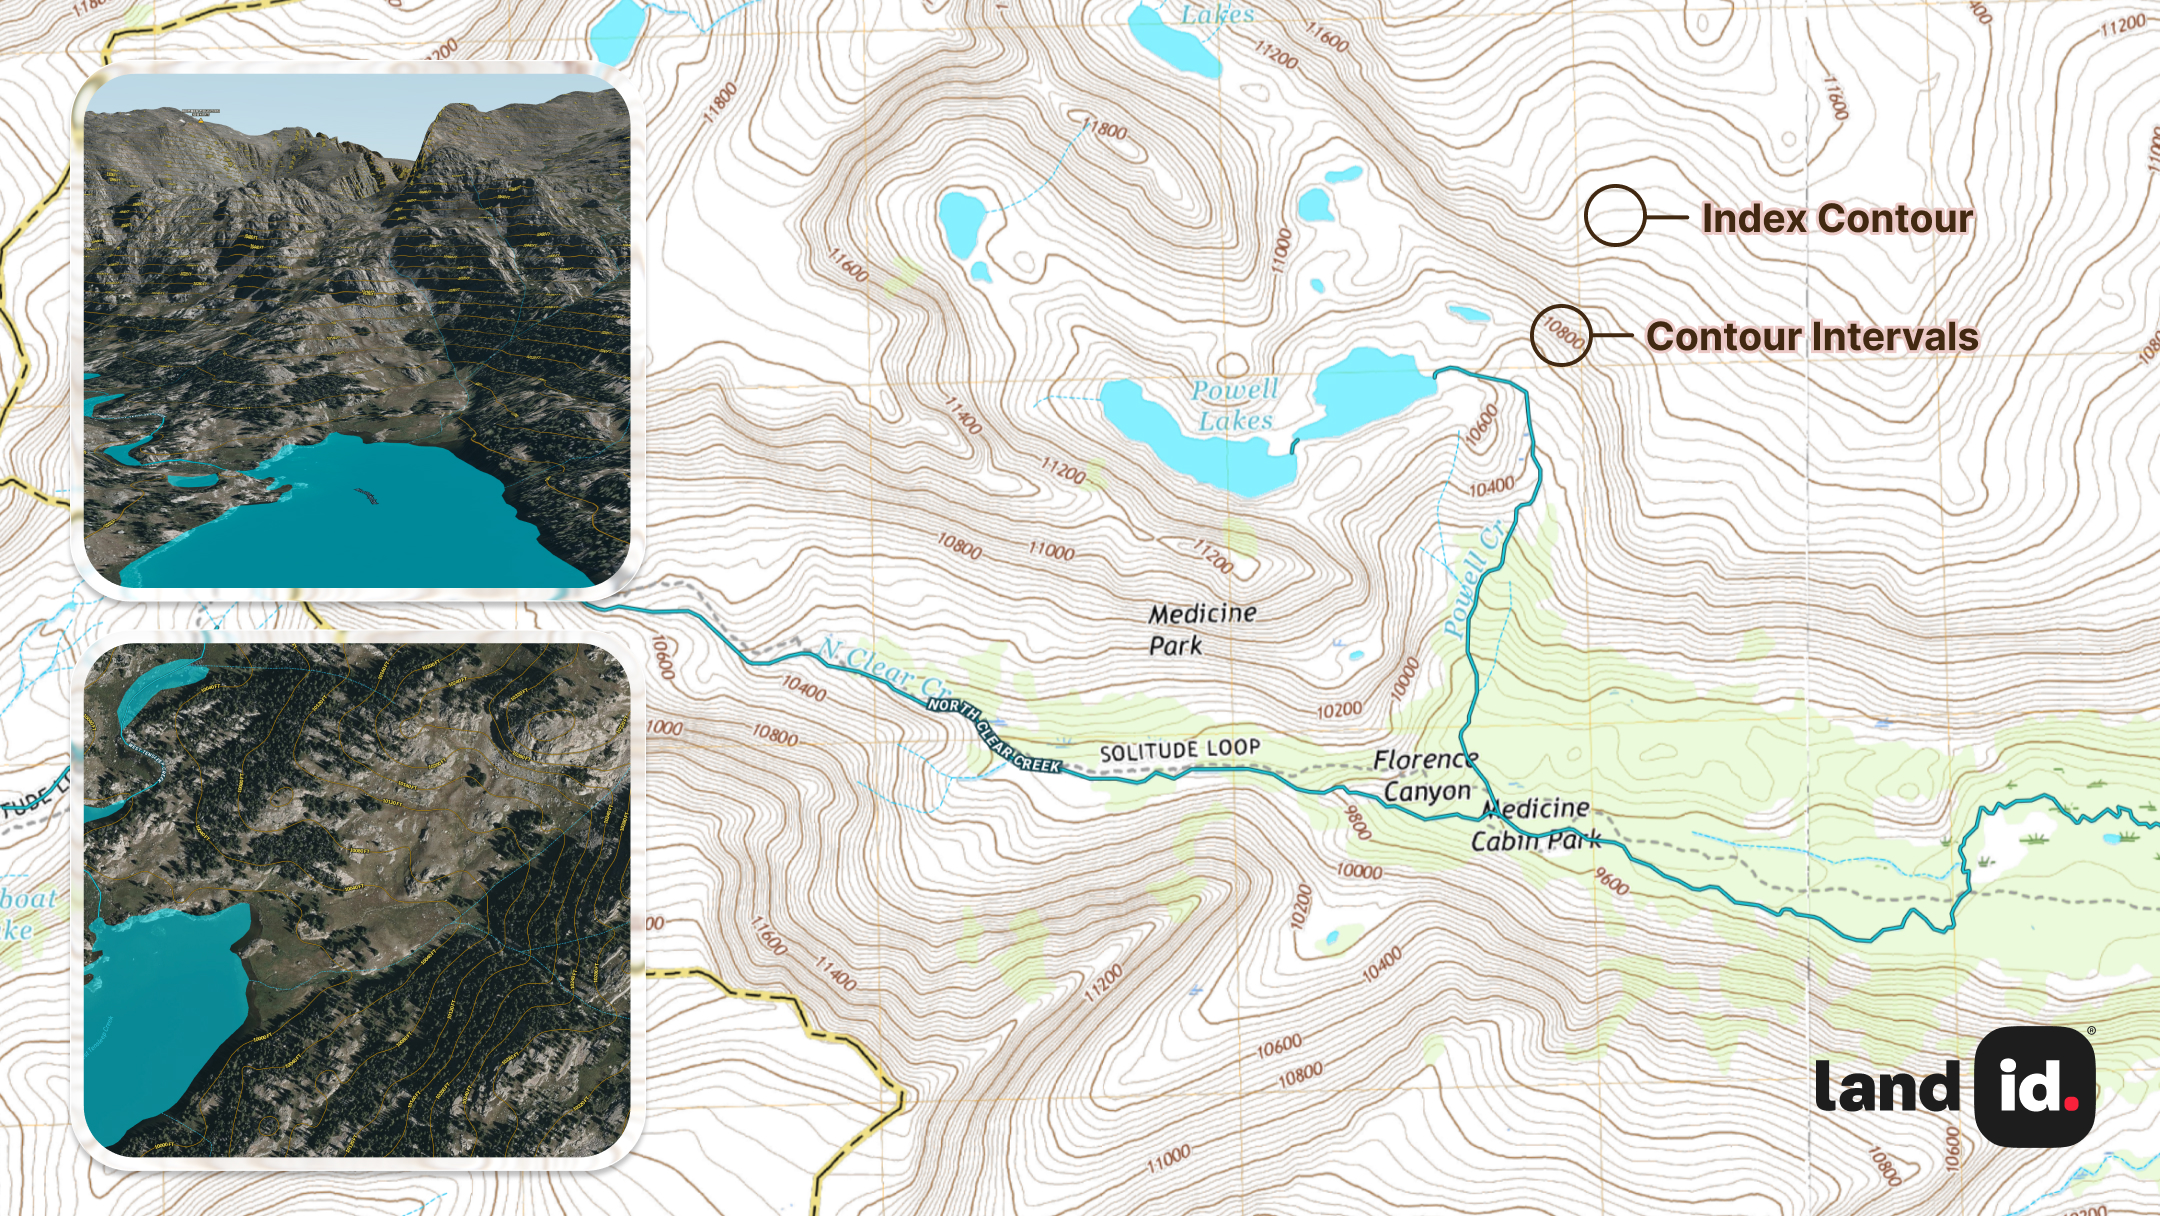
The contour interval is the vertical distance between adjacent contour lines. This value is always listed in the map legend; common intervals include five, 10, 20, or 40 feet (or one, five, 10, or 20 meters).
Key elements to identify:
- Index contours: Thicker lines labeled with elevation values
- Intermediate contours: Thinner lines between index contours
- Map scale: Indicates how distances on the map relate to real-world measurements
Smaller contour intervals provide more detail but can make maps cluttered. Larger intervals show less detail but offer clearer views of major terrain features.
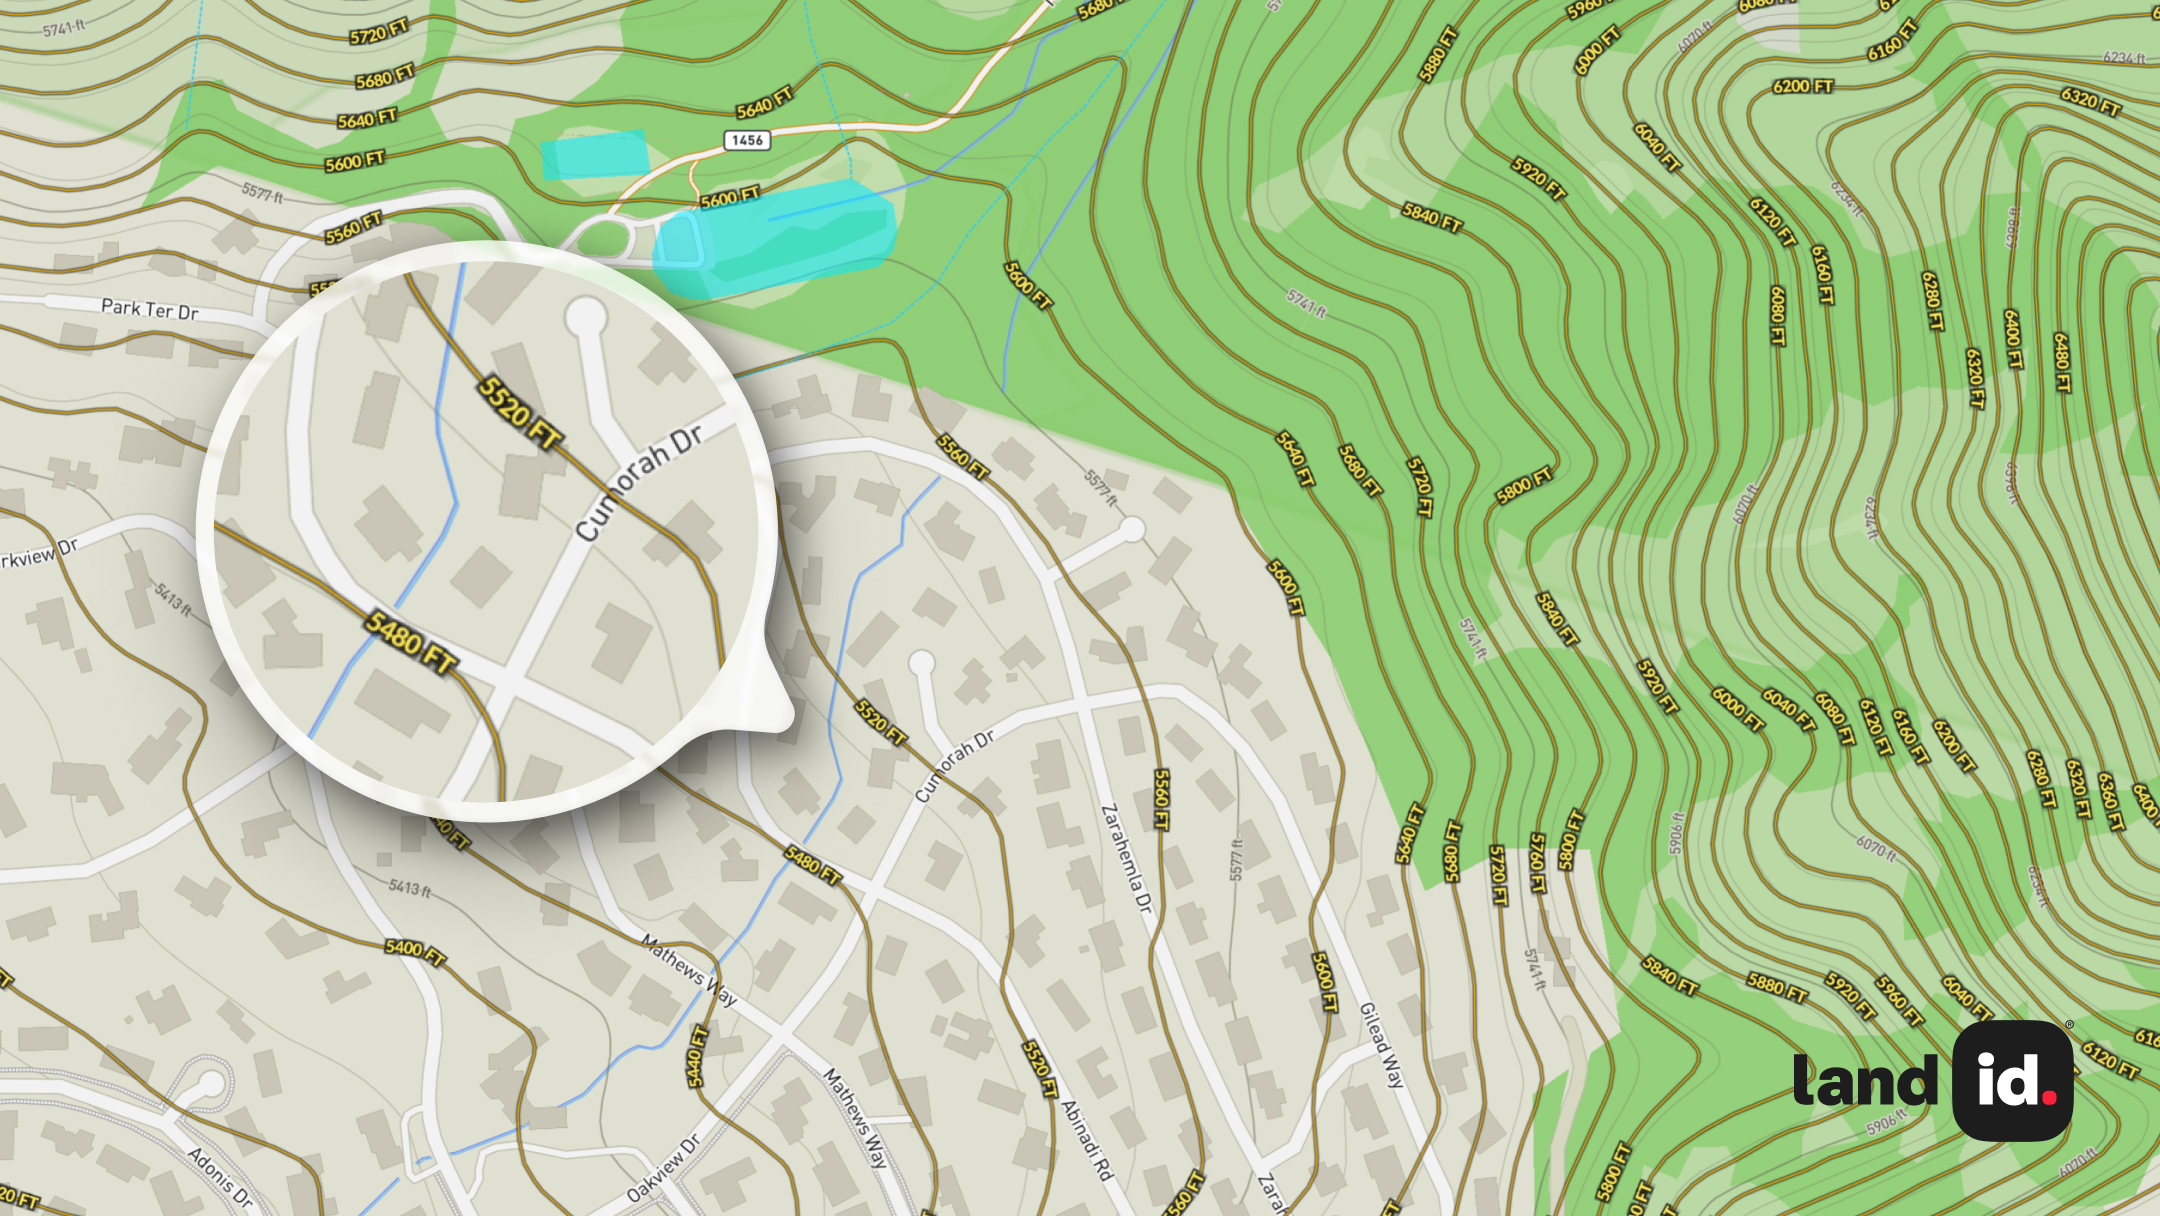
Use Spacing to Interpret Slope Steepness
The horizontal distance between contour lines reveals how steep or gentle a slope is:
- Closely spaced lines: Indicate steep terrain like cliffs or sharp hillsides
- Widely spaced lines: Show gentle slopes or nearly flat areas
- Evenly spaced lines: Represent uniform slopes with consistent steepness
This visual pattern holds true across all types of landscapes, making it a quick and reliable way to evaluate slope difficulty, accessibility, or suitability for development.
Recognize Common Landforms
Contour patterns reveal specific terrain features:
- Hills and mountains: Appear as roughly concentric closed loops, with elevations increasing toward the center.
- Valleys and drainages: Form V-shaped patterns pointing upstream.
- Saddles: Appear as hourglass-shaped patterns between higher areas.
- Ridges: Long, narrow elevated areas (V-shaped contours). Useful for determining development feasibility and identifying elevation gain.
- Saddles: Dip between two peaks (hourglass shape). Important for planning access routes or identifying potential building sites.
- Basins and depressions: Closed concentric loops. Useful for identifying drainage areas or potential water accumulation zones.
- Spurs: Extensions of ridges (contours form a "V" pointing away from higher ground). Helpful for understanding drainage direction and land accessibility.
- Cliffs: Very closely spaced or overlapping lines. Critical for assessing slope stability and construction risk.
Being able to recognize these patterns helps you visualize the three-dimensional landscape from contour lines on a topographic map. Each of these landforms can be tied to real Land id use cases, such as determining development feasibility, identifying elevation gain, and understanding drainage direction.
Identify Human-Made Terrain Features
While contour lines are often associated with natural landforms, they also capture terrain changes created by human activity. Understanding these features is especially important when analyzing developed or semi-developed land.
Common human-made terrain features include:
- Terraces: Stepped landforms used in agriculture or landscaping
- Retaining walls: Indicated by sharp elevation changes
- Road cuts and embankments: Altered slopes along roads or railways
- Quarries and excavation pits: Closed loops with steep gradients
- Artificial drainage features: Man-made channels or ponds, often geometric
Recognizing these helps distinguish engineered terrain from natural slopes, especially important in urban planning or redevelopment projects.
How to Use Land id's Contour Lines Overlay for Real Estate & Land Management
Contour lines provide crucial information for property professionals and landowners making decisions about land use and development. Land id's Contour Lines Overlay can provide key insight into the shape of your land and expose the challenges and opportunities for development.
Property Assessment & Planning
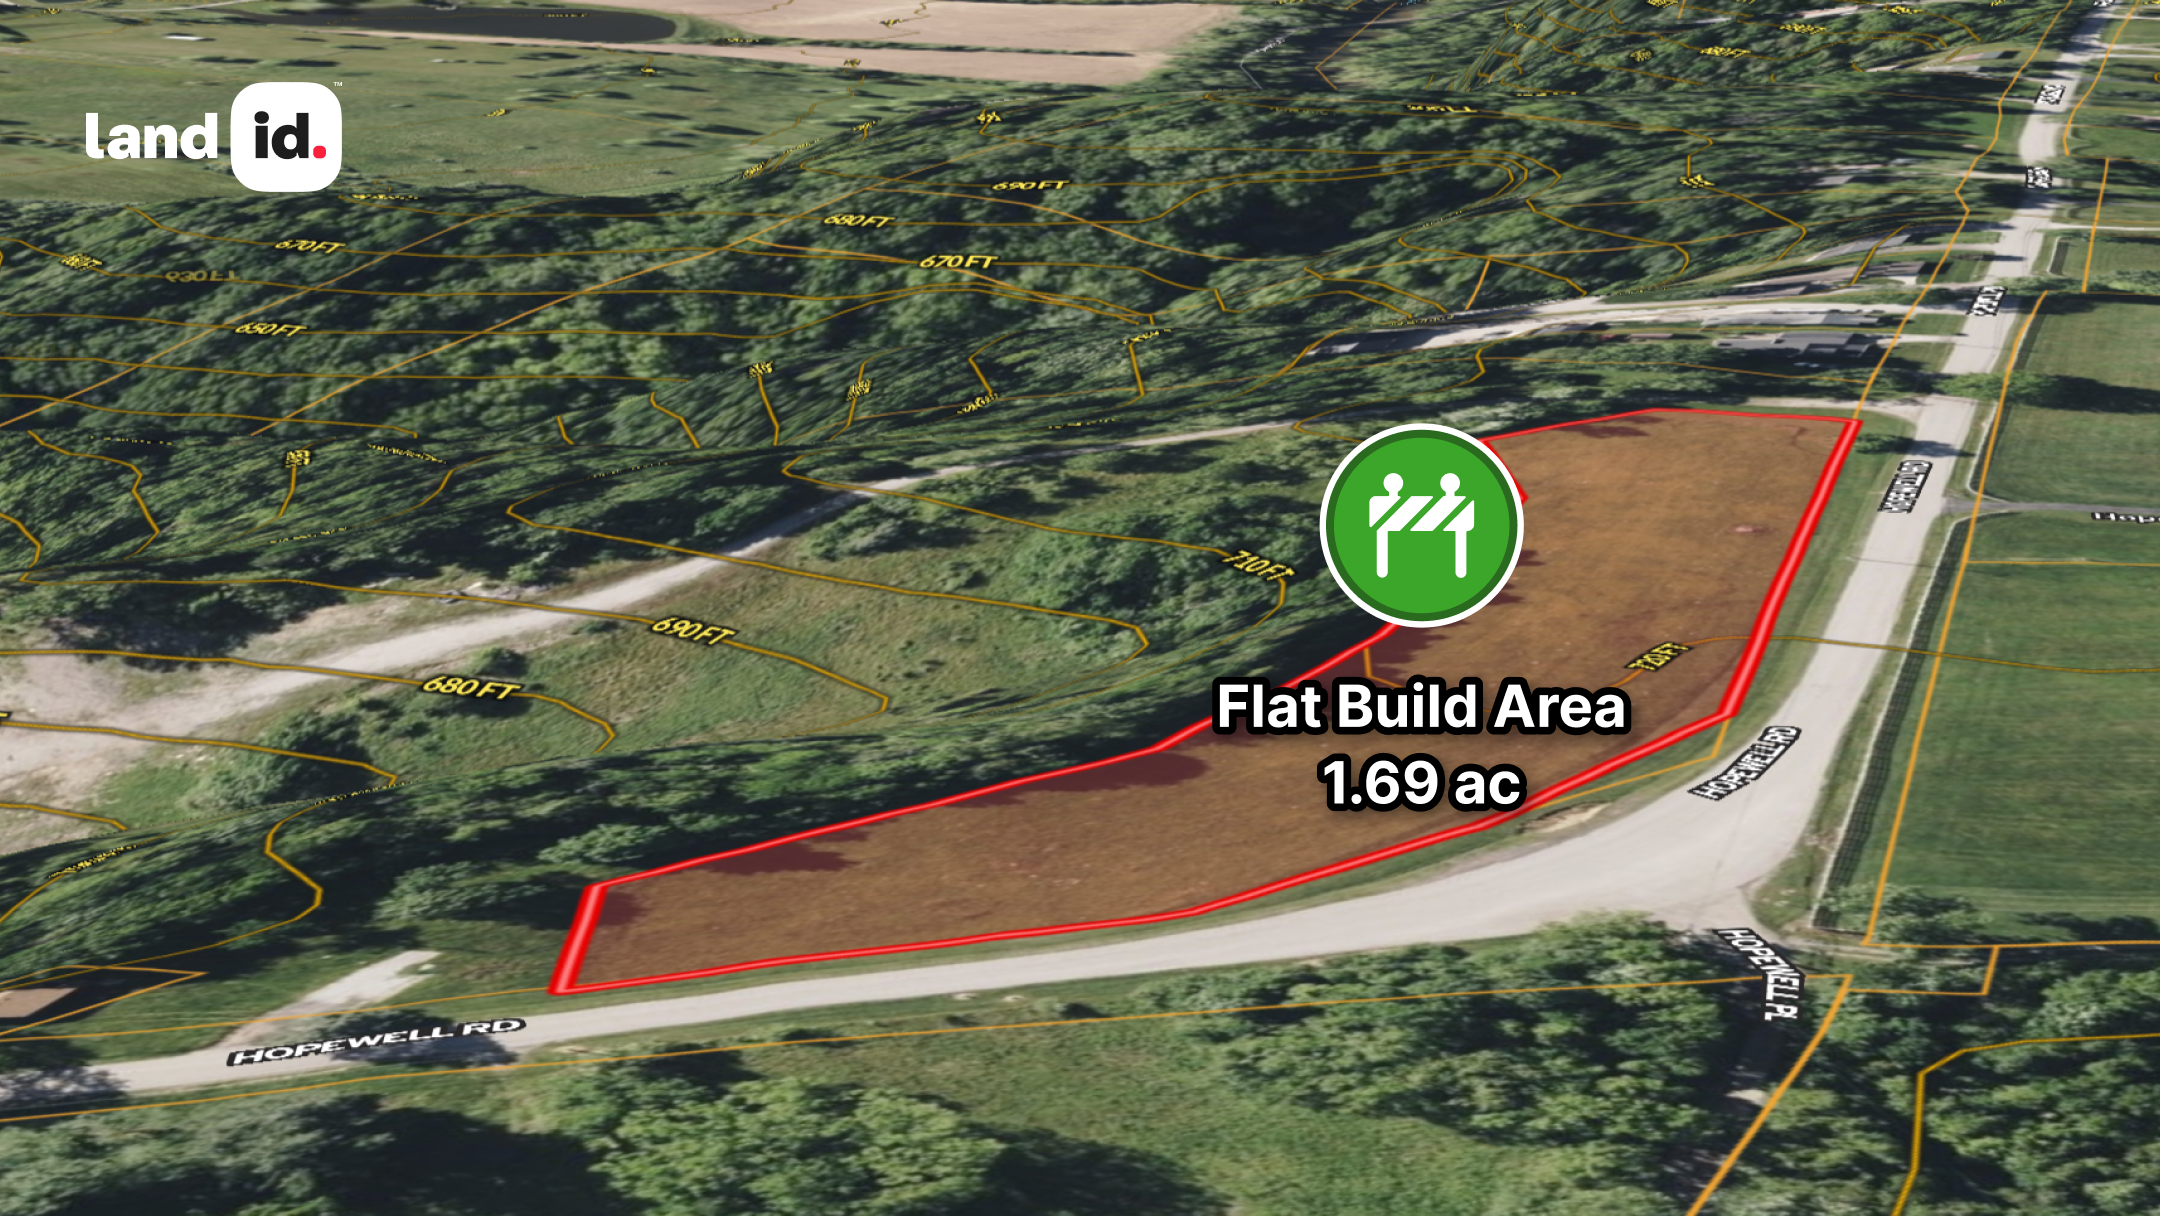
- Site selection: Identify flat areas suitable for building versus steep slopes requiring special engineering.
- Access planning: Design roads and driveways that follow gentler slopes for easier construction and maintenance.
- View analysis: Determine which areas offer the best views based on elevation and surrounding terrain.
In real estate development, contour maps also help calculate cut-and-fill requirements, estimating how much earth must be moved to level a site. This can lead to major cost savings when selecting building locations that align with the existing terrain.
Water Management
- Drainage patterns: Predict how water will flow across the property during rainfall
- Flood risk assessment: Identify low-lying areas that may be prone to flooding
- Watershed boundaries: Determine where water collecting on your property will flow
These insights are critical not just for stormwater control but also for long-term sustainability and regulatory compliance.
Land Use Optimization
- Agricultural planning: Find areas with appropriate slope for different crops or grazing
- Forestry management: Plan harvest operations based on terrain accessibility
- Conservation efforts: Identify sensitive areas that may require special protection
Zoning & Compliance
In addition to guiding design and planning, contour lines also play a critical role in zoning and regulatory compliance.
- Slope thresholds: Many municipalities limit development on slopes steeper than a set percentage.
- Setbacks and buffers: Elevation may impact required setbacks from water, roads, or property lines.
- Environmental protections: Certain elevation zones may trigger special environmental rules.
- Stormwater management: Terrain shapes drainage paths that affect permitting and design.
Using our Contour Lines Overlay early in the planning process helps you avoid regulatory issues, streamline permitting, and plan development that fits within legal constraints.
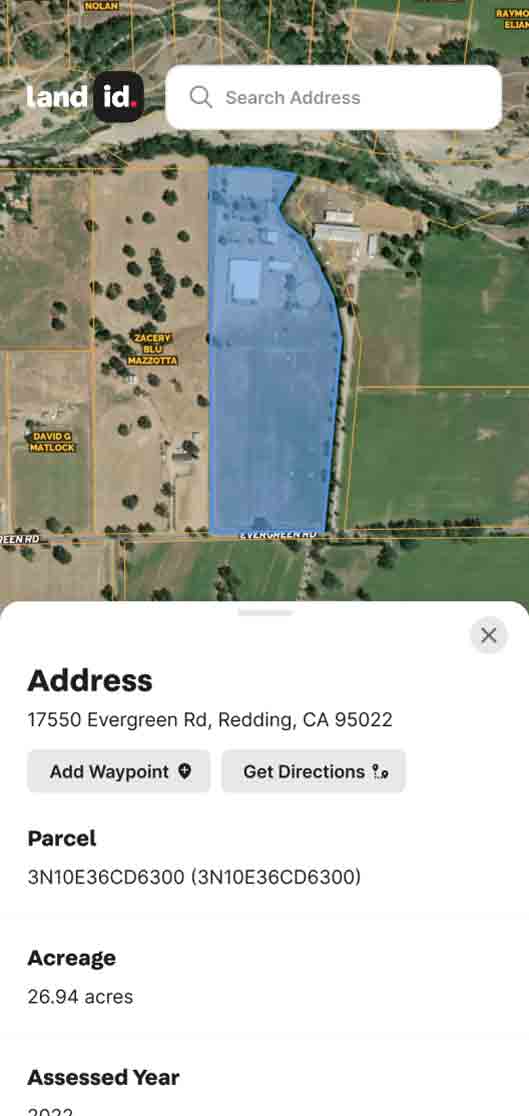
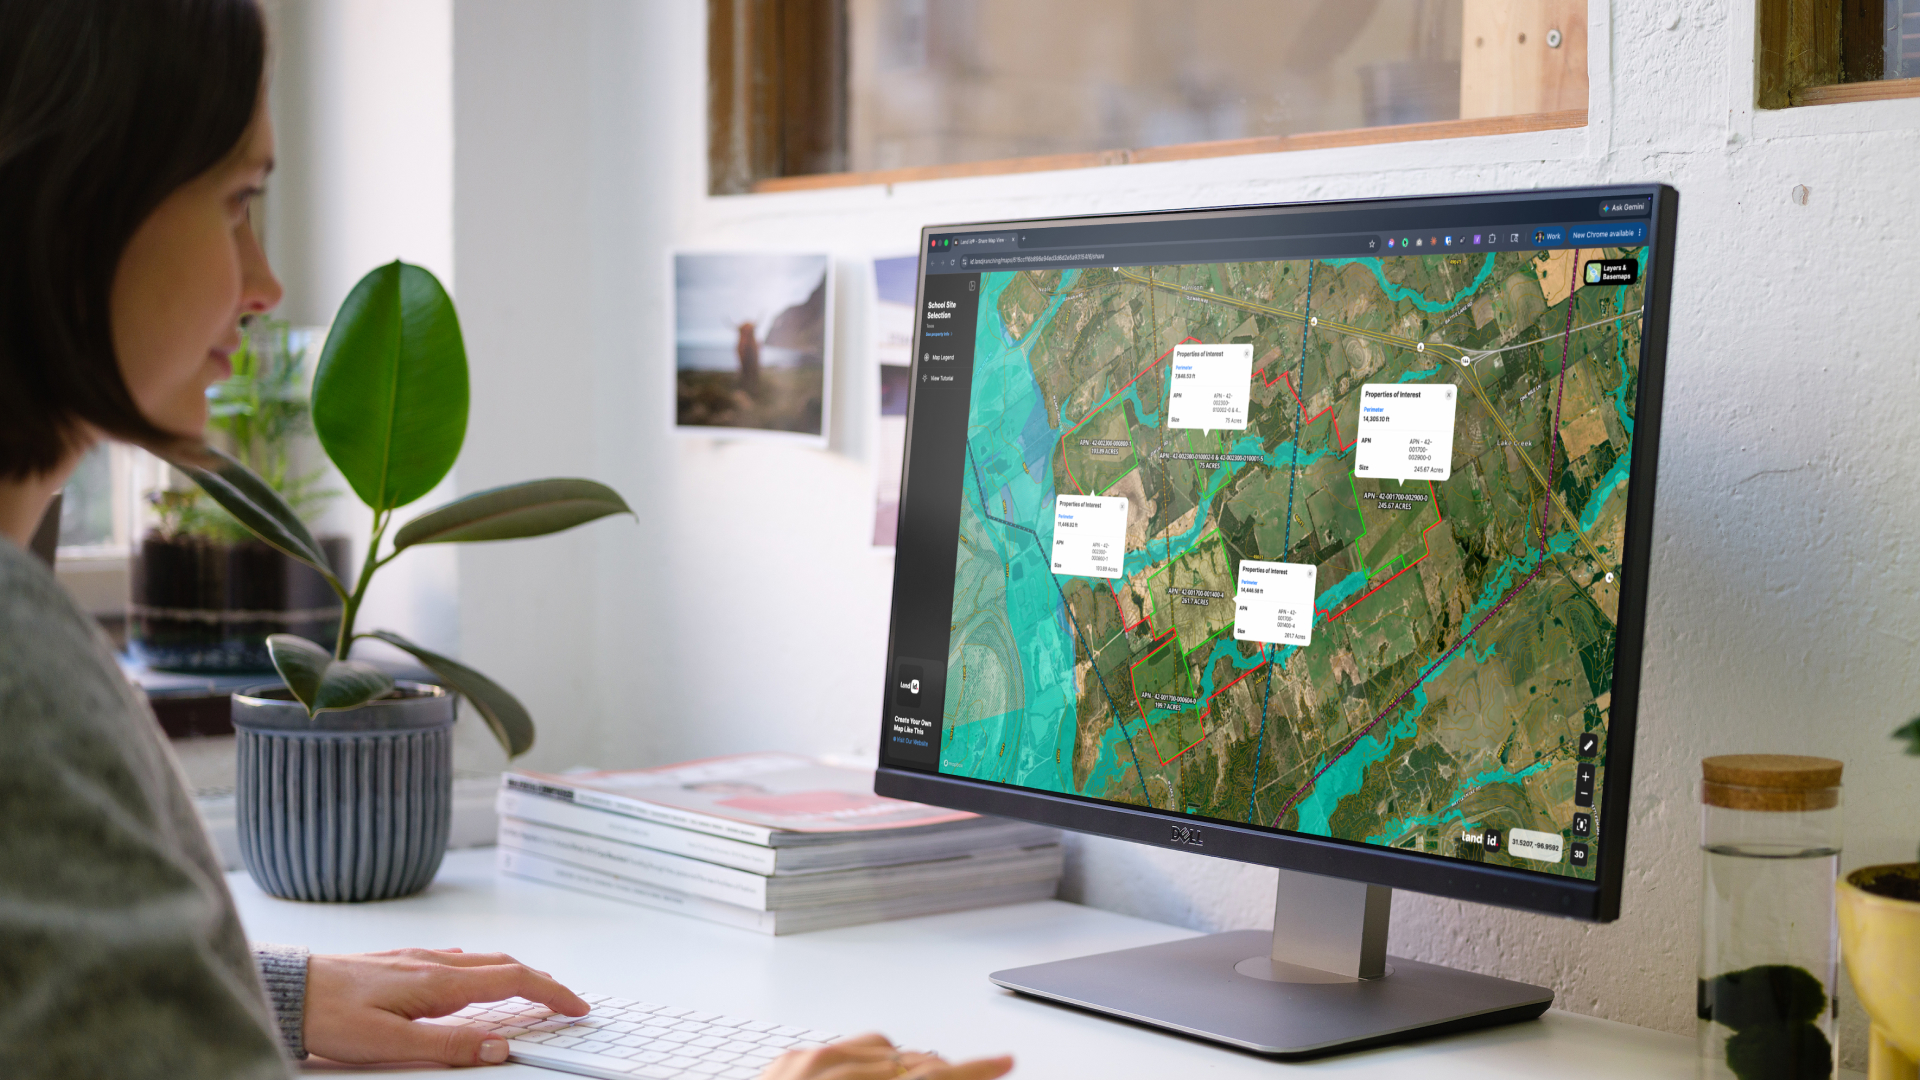
Land id simplifies contour analysis by layering elevation data with property boundaries, zoning, parcel and ownership data, and other key property details. This integrated view gives you a clearer understanding of terrain, helping you make faster, more informed decisions.
To support these workflows, Land id sources the highest-resolution contour lines available, with intervals ranging from 1 to 20 feet, depending on the area. Each contour line is labeled with its elevation in feet, making it easy to visualize topography, assess slope, and understand how the land behaves.
This level of detail is especially useful when planning features like homesites, fencing, livestock facilities, or pond placement. By combining high-precision elevation data with over 40 property data layers, Land id empowers you to confidently evaluate landform features, drainage patterns, and development opportunities.
Learn more about how to use the Contour Lines Overlay in our Help Center.
Elevate Your Land Knowledge With Land id
Reading contour lines helps you understand the terrain. Putting that insight to work is where the real value lies.
Land id gives you the tools to do exactly that—turning topographic data into practical decisions for planning, development, and land management. With high-resolution overlays, intuitive mapping, and seamless sharing, it's built to support your goals.
Try it free for 7 days and see how Land id can help you move from analysis to action.
FAQs
What is the difference between contour lines and topography lines?
How do I find the contour interval on a topographic map?
Can contour lines show underground features?
Why are some contour lines thicker than others on topographic maps?
How accurate are contour lines on modern maps?
Continue Reading
Craig Rowe
Prospecting, Part 3: Find Land Faster
.png)
By Land id
How real estate investors and developers can use Land id to discover and analyze land-buying opportunities in less time.
How to Price Land for Sale Using Comparable Sales Data
By Land id
Learn how to price land using comparable sales. Find, analyze, and adjust vacant land comps to price listings accurately and sell with confidence.

Explore Private Parcel Data & Property Boundaries
Download the Land id app and try for free.