The first-ever topographic maps were said to have been formed by the British in the late 18th century, and soon after, the US followed suit. Back then, the US had a department called the “Topographical Bureau of the Army,” which used these maps to plan tactical strategies during the War of 1812. However, even when the war ended, our interest in topography remained.
By 1884, John Wesley Powell had convinced Congress to authorize the U.S. Geological Survey (USGS) to begin work on a topographic map of the entire United States. In those days, topographic surveyors used field surveys to map the terrain, but this method was later replaced by photogrammetry in the 1920s, which reached wide-scale adoption after World War II.
In the 1970s, the USGS set out to modernize the process further. They digitized existing maps, automated map creation, and created a land-cover data-generating program called Land Use Data Analysis. This topographic map maker, and its accompanying software, the Geographic Information Retrieval and Analysis System, paved the way for the first comprehensive land-cover dataset for the contiguous 48 United States.
What Is Topography?
The term “topography” comes from a combination of two Greek words: “topo,” which means place, and “graphia,” which means writing. It is used to describe the study of a region’s forms and features, primarily to show their relative positions and elevations. Topography could refer to the forms and features themselves or a depiction of them (such as a map).
How Topography Is Used
People working in an array of different industries use a topographic map maker to help aid in what they do:
- Geologists use topography to better understand tectonic activity and where to carve out mines.
- Astronomers use topography to learn about the surface of planets and asteroids.
- Outdoor enthusiasts use topography to find hiking trails and determine the steepness of an incline.
- Paleontologists use topography to identify areas (such as sinks and incised streams) where fossils may be present.
- Engineers use topography to plan their projects. For example, with knowledge of an area’s topography, engineers can make sure that the buildings they design are structurally sound.
What Are Topographic Maps?
Unlike traditional maps which only represent the land horizontally, one made with a topographic map maker will represent the land vertically as well. These maps, also referred to as topo maps, show the form and elevation of an area, including the location and shape of hills, valleys, mountains, streams, and other natural or human-made features.
How To Read Your Topographic Map Maker
Contour Lines
Contour lines are the primary way in which topographic maps depict elevation. These imaginary lines connect points of equal elevation in order to present three-dimensional information on a two-dimensional map. This allows the viewer to visualize the height and shape of mountains, the depth of canyons, and the location of flat plains.
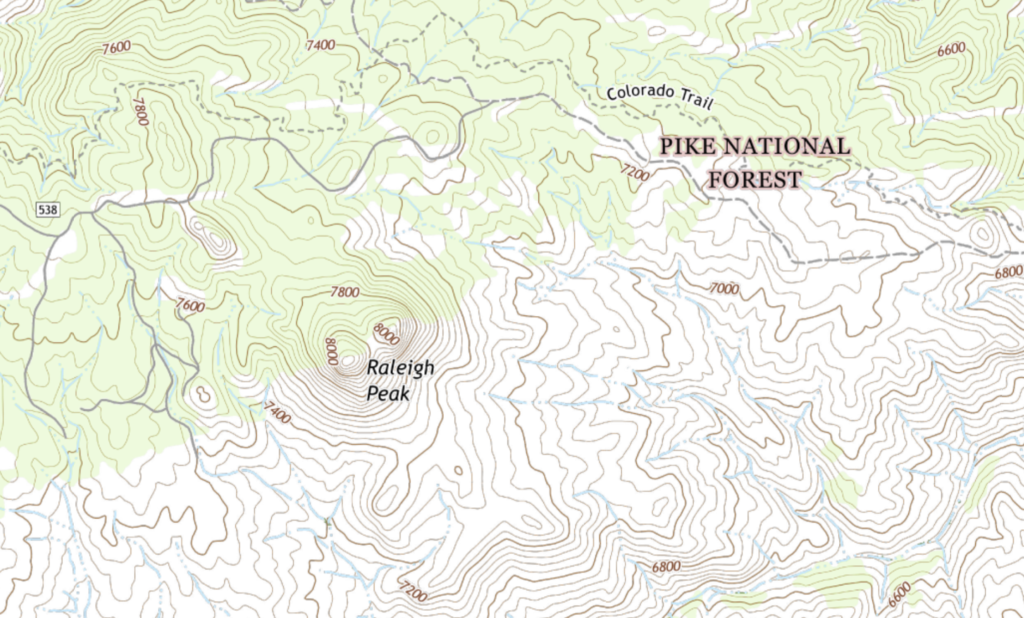
To determine the exact elevation of a location, you’ll need to know the contour interval – the difference in elevation between two contour lines. This will vary depending on the map, but regardless, you can calculate them yourself fairly easily. First, find the bolded contour lines that contain a number. These are the index contours, and the number is the elevation at the line.
Then, count the number of contour lines between each index contour, and divide the difference in elevation by that number. For instance, if you had one index contour with an elevation of 7,800 five contour lines apart from another index with an elevation of 8,000, the contour interval would be 40 ( (8,000 - 7,800) / 5 = 40 ).
Steepness
The contour lines produced by your topographic map maker are often used to determine the slope or steepness of an area. The lines will be spaced farther apart when the slope is gentle, and closer together when the slope is steep. This is because, in steep areas, the elevation will increase at a greater frequency, so the lines will appear closer together. A completely flat meadow will have no contour lines, while a vertical cliff will have contour lines that are stacked on top of one another.
Features
You can also use contour lines to identify features of the land.
- Peaks and Depressions: The innermost ring at the center of several other rings will typically represent a peak, but in some cases, it could represent a depression.
- Valleys: A valley is a type of depression in which water could flow down (if water is present), and they can be identified by their V or U shaped contour lines that point towards higher elevation (the peak).
- Cliffs: When two or more lines join together to form a single line, they represent a cliff. However, if the change in elevation isn’t great enough to call for another contour line, the cliff may not appear on the map.
- Ridges: A ridge is a chain of mountains or hills that create a continuous summit for an extended distance. These can be identified by V or U shaped contours that point towards lower elevation.
- Saddles: A saddle is a low spot between two higher points of elevation, and on a topographic map, they appear as hourglass shaped contour lines.
Create Your Own Topographic Map With Land id®
Now that you know how to read a topo map, why not test your skills and build one yourself? With Land id’s (formerly MapRight) topographic map maker, all you have to do is toggle on one of our two topographic base layers, vintage topo or modern topo. From there, you’ll be able to see the contour lines, the names of peaks and trails, and the exact coordinate location of anywhere on the map. The vintage topo layer will even show township and range.
You can then add as many layers as you choose to give further insights into the land – soil surveys, parcel data, public lands, water features, county lines – and the list goes on. Finally, add icons and labels to help viewers spatially understand the area, attach photos and videos to exact points on the map, and track your location and movement through the land. Once your map is complete, you can share it with anyone you choose over email, text, or by uploading it online with the embed script we provide.
Interested in creating a beautiful topographic map (or any type of map for that matter)? Start your 14-day free trial of Land id® now!
FAQs
Continue Reading
Craig Rowe
How Factory-Built Housing Can Reshape America’s Housing Market
.png)
By Land id
The U.S. housing industry’s decade-plus-long inventory challenge could see its first true sign of resolution should the 21st Century Road to Housing Act become law.

Craig Rowe
Can Refurbishing Schools Help Solve Housing Issues?
By Land id
Old public schools are becoming apartments as enrollment drops. See why school-to-apartment conversion is adaptive reuse's fastest-growing niche.


Explore Private Parcel Data & Property Boundaries
Download the Land id app and try for free.