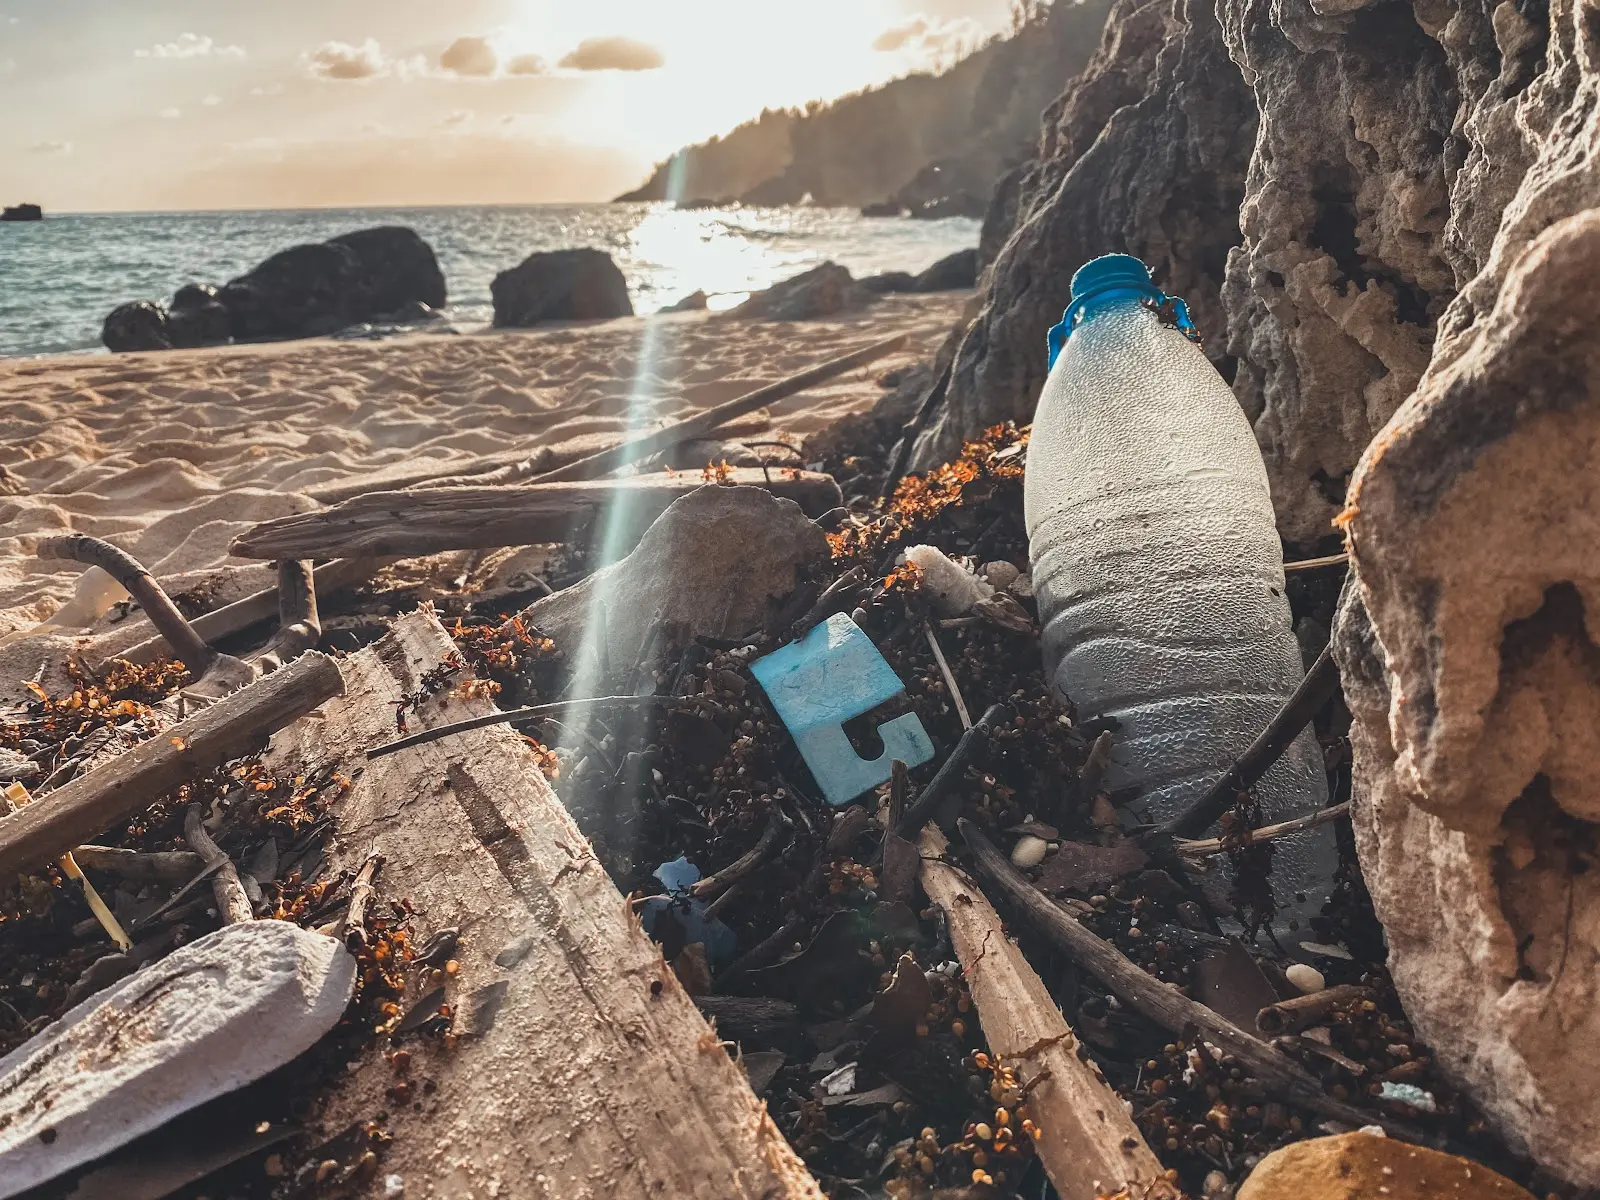
The versatility of GIS cannot be understated. It has been used to map planets, underwater continents, tree density, murder hornets, and now…garbage? Ocean microplastics, to be exact.
According to the International Union for Conservation of Nature (IUCN), at least 14 million tons of plastic end up in the ocean every year, making up 80% of all marine debris found from surface waters to deep-sea sediments. Once they enter our oceans, these plastics are broken down by waves and sunlight into small microplastics as they’re carried by ocean currents. Much of these microplastics collect in the calm centers of ocean gyres, becoming large garbage patches. The most well-known of these is the Great Pacific Garbage Patch, but there are many others.
All of this plastic pollution in our oceans has far-reaching impacts. It threatens food safety and quality, endangers the health of marine species and humans, negatively affects coastal tourism, and contributes to climate change. That’s why getting a clearer picture of where the microplastics are in our oceans is so important; in order to take out the trash, you have to find it first.
Mapping the Trash
Typically, marine garbage is estimated in garbage patches by dragging nets behind boats. Besides being a geographically limited sampling method, it doesn’t give researchers a sense of how plastic concentrations change over time. So, researchers at the University of Michigan developed a new method to map ocean microplastics around the world using the power of GIS technology.
They used data from eight microsatellites that are part of the Cyclone Global Navigation Satellite System (CYGNSS) mission to determine the roughness of the ocean’s surface. Radio signals from GPS satellites reflect off the ocean surface, and CYGNSS satellites detect those reflections. Scientists then analyze these signals to measure roughness.
Normally, these signals provide scientists with a means to derive ocean wind speeds, but they also reveal the presence of plastics on the ocean surface. When there is plastic or other debris near the ocean surface, waves are dampened, making the sea surface appear less rough than it would be otherwise.
When there is a high concentration of plastic on the surface of the ocean, you see a bigger discrepancy between wind speed measurements and the roughness of the surface. Therefore, by comparing CYGNSS roughness measurements to NOAA measurements of ocean wind speeds from buoys and other instruments, researchers were able to see the areas in which data discrepancies existed.
Researchers mapped concentrations of microplastics across the ocean for more than a year. The dataset was recently published by NASA’s Physical Oceanography Distributed Active Archive Center (PO.DAAC), and you can watch the time lapse animation here.
Cleaning the Oceans
This research has revealed some seasonal patterns not previously understood. In the Great Pacific Garbage Patch, for example, microplastic concentrations appear greater in the summer and lower in winter. This could be due to more vertical mixing of the ocean when the temperatures drop.
In addition to mapping the oceans, they also created time-lapse views of all of the major rivers in the world, noting particularly large amounts of microplastics coming from the Yangtze and Ganges rivers. This is especially useful information since we know the majority of plastic pollution enters the world’s oceans exclusively through rivers and streams. If we want to decrease the amount of pollution making its way to the ocean, river cleanups are a great place to start.
Because this is the first time ocean microplastics have been mapped over such a large area on a daily scale, this data will be incredibly helpful in understanding how microplastics move around in our oceans. With this information, we can figure out the best and most efficient ways to clean up beaches or stop plastic from reaching the ocean in the first place.
What Can You Do With GIS?
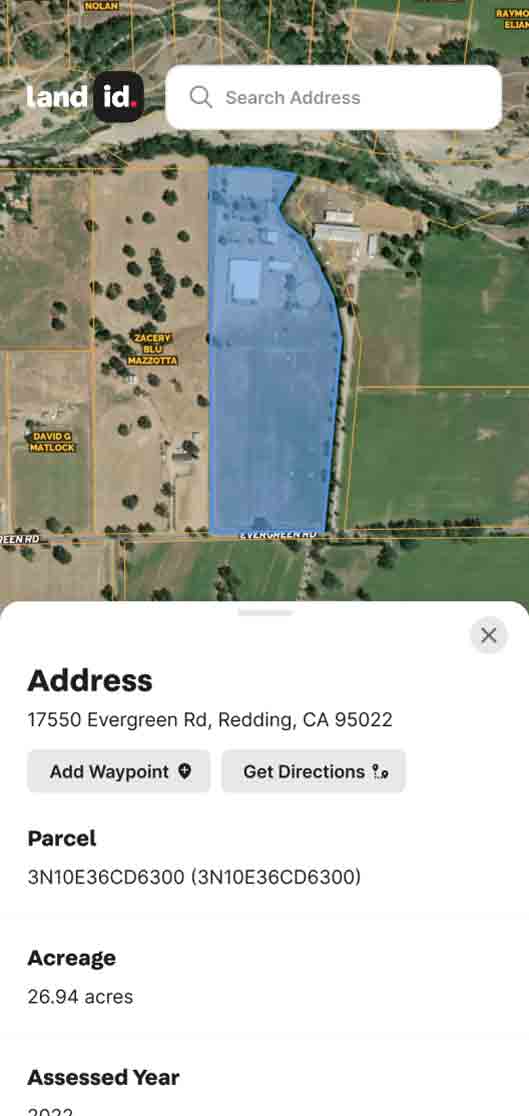
Your aims may be less ambitious than globally mapping ocean microplastics, but that doesn’t mean GIS can’t help. Whether you’re a land manager, real estate agent, appraiser, engineer, city manager, or anyone else with a vested interest in the land, GIS technology will make your job much easier.
If this technology seems a little intimidating to you, you’re not alone; that’s where Land id® comes in. You can make your first map in minutes, using seven different GIS base layers, 40+ Land id® layers, and countless styling and customization options to make your interactive map look perfect before you share it with others.
It’s easy to get started, too. Just sign up for our 7-day free trial today!
FAQs
Continue Reading
Craig Rowe
How Factory-Built Housing Can Reshape America’s Housing Market
.png)
By Land id
The U.S. housing industry’s decade-plus-long inventory challenge could see its first true sign of resolution should the 21st Century Road to Housing Act become law.

Craig Rowe
Can Refurbishing Schools Help Solve Housing Issues?
By Land id
Old public schools are becoming apartments as enrollment drops. See why school-to-apartment conversion is adaptive reuse's fastest-growing niche.

Explore Private Parcel Data & Property Boundaries
Download the Land id app and try for free.