According to Statista, 74 zettabytes of data will be created in 2021 alone - that’s 74 trillion gigabytes. Needless to say, there are massive amounts of data in circulation, and as smart devices become increasingly prevalent, that number is only expected to rise.
Since data is a defining characteristic of GIS, this is great news for professionals in the industry, but unfortunately, there is a catch: not all data works with GIS software. The challenge is finding the right data in the right format. In order to do so, it’s helpful to know how data is collected, how secondary data is sourced, and how to transform that data into usable forms.
Primary GIS Data Collection
Spatial data, or data related to a specific location on Earth, comes in two main forms: raster and vector. Both types of spatial data can be paired with attribute data, which describes any additional information that isn’t tied to location. For example, the height and coordinates of a building would be classified as spatial data, while the name of that building would be considered attribute data.
Raster Data
Raster data is a form of spatial data comprised of pixels arranged in rows and columns. Each pixel represents a geographic location, and the value of each pixel represents a characteristic of that location. While raster data looks very similar to digital photographs, in the context of GIS, the two are not necessarily one and the same. Rasters represent real-world occurrences, such as temperature and elevation, and are tied to a specific location on the Earth’s surface, while traditional photographs merely depict an image.
Remote Sensing
Remote sensing is used to determine the chemical, physical, and biological properties of an area without physical contact - making it one of the most popular methods for gathering raster data. This type of GIS data collection is primarily carried out by satellites and aircraft sensors, which can assess the characteristics of a location by measuring the electromagnetic radiation objects on the surface emit.
Remote sensing is advantageous to GIS professionals for several reasons. To start, remote sensing can cover massive areas, including spots that would be difficult to get to physically (such as the middle of an ocean). In addition, this GIS data collection technique allows for continuous information gathering, which can be helpful when monitoring local temperatures, assessing water levels, measuring air quality, etc.
Photography
One form of remote sensing used for GIS data collection, typically conducted by high-quality analog optical cameras, is photography. GIS photography can come in many different forms, including satellite images, aerial photographs, thermal images, and digital elevation models (DEMs).
While extremely useful, digital elevation models are more challenging to create than traditional photos are. To make one, you’ll have to use stereo imagery, which means you’ll need two satellites to take a picture of the same location from different angles.
In contrast, aerial photography is one of the earliest, simplest remote GIS data collection methods - and today, it’s one of the cheapest. Aerial photography tends to capture small areas from a much lower height than satellite imagery. While the two can find similar types of information, aerial photography is typically reserved for smaller-scale applications such as agricultural management, land use, and marketing properties.
Vector Data
Unlike the grids and pixels associated with raster data, vector data depicts spatial information through points, lines, and polygons. Points often represent coordinates, lines represent linear features such as roads and streams, and polygons represent areas, such as property boundaries, bodies of water, or city limits.
Survey
Though not the most efficient or cost-effective methodology, ground surveys are the most accurate form of vector-based GIS data collection. For this reason, surveys tend to be the method of choice when it comes to measuring buildings, property lines, and other features where precision is a top priority. The basic principle in play here is that location can be determined by assessing the direction and distance from other known locations. Accordingly, surveys are an excellent way to determine a reference point for other forms of GIS data collection.
LiDAR
LiDAR which stands for Light Detection and Ranging, is a relatively new technology used for GIS data collection. If topographic surveys weren’t exciting enough already, these surveys are created with lasers. LiDAR is rather complex, but the main components are low flying aircraft and GPS technology. The instruments gather in-depth information on the Earth’s shape by scanning an area with flashing lights, resulting in an accurate, almost instant topographic survey.
Digitizing Hard Copy Data
GIS data doesn’t serve much of a purpose if it can’t be uploaded into GIS software, and to make sure it can be, you’ll have to digitize it. Digitization is the process of converting hard copy data, such as maps, printed images, and documents, into a digital format. Beyond the fact that software requires digital data, there are plenty of reasons to digitize documents. First of all, digitization protects paper files from accidental destruction, misplacement, and regular old wear and tear. Perhaps even more importantly, however, is that digitization allows different forms of data to interact with one another.
Methods
Scanning
Scanning is one of the simplest ways to convert physical documents into digital formats. When you scan a document, the scanner uploads a digital image of the page. Like all images, scanned documents will appear in raster format.
Photogrammetry
Photogrammetry is the process of determining measurements from overlapping images, essentially creating 3D models by analyzing multiple photos of a single area. This complex science is surprisingly affordable and can result in very detailed topographic visualizations.
Vectorization
Comparing raster and vector data is like comparing apples and oranges; in order to analyze and draw conclusions from GIS data, it has to be integrated. Photographs, satellite imagery, and scanned files will typically start in raster format, so they’ll likely need to be converted into vectors to be used - a process referred to as vectorization. Converting pixels to points can take a great deal of time by hand, but luckily, GIS software can help speed up the process.
One situation where vectorization may be necessary is when using an aerial photograph to create a property map. In this case, the process could look like the following:
- Step 1. Scan the aerial photograph
- Step 2. Upload the scanned photo to GIS software
- Step 3. Vectorize the photograph (converting it from pixels to polygons)
- Step 4. Create a map layer with the vector data
Once the GIS software has created a map layer with the photo data, it can determine the area of features, measure the distance between objects, and make other conclusions of a similar nature.
Data Transfer
For many projects, it would be nearly impossible to gather all of the necessary data on your own. That’s where external data sources come in. Regardless of where the data comes from, GIS software can overlay all of the information into a single, layered map.
Sources
Any information tied to a specific location can be a part of GIS data collection. According to National Geographic, there are four main categories of GIS data:
- Cartographic data: cartographic data is already in a map format and describes the location of features, the location of buildings, survey information, etc.
- Photographic data: photographic data can be used to analyze and map features from print and digital photos, satellite imagery, and aerial photography.
- Digital data: Digital data includes any information that’s already in digital format, including tables, satellite findings, and any data that’s been digitized by another GIS professional.
- Spreadsheet data: This includes information in tables and spreadsheets, which typically need to be formatted as an Excel or CSV (comma-separated values) file. Spreadsheets are often the go-to source for demographic information such as age, income levels, or even spending habits.
Process
While there’s no shortage of public data, there’s also little to no standardization, making it difficult to find data in the right format. However, just because data isn’t formatted correctly doesn’t necessarily mean it’s unusable - it just needs to be translated.
There are two main components to translating data for GIS software, syntactic and semantic translation. Syntactic translation is by far the easier of the two, as it only involves translating symbols such as letters and numbers between systems. Semantic translation, on the other hand, is a bit more complicated. It aims to decipher the meaning behind the data, and though progress has been made, semantic translation tends not to be very accurate.
GIS Data Collection Made Easy With Land id®
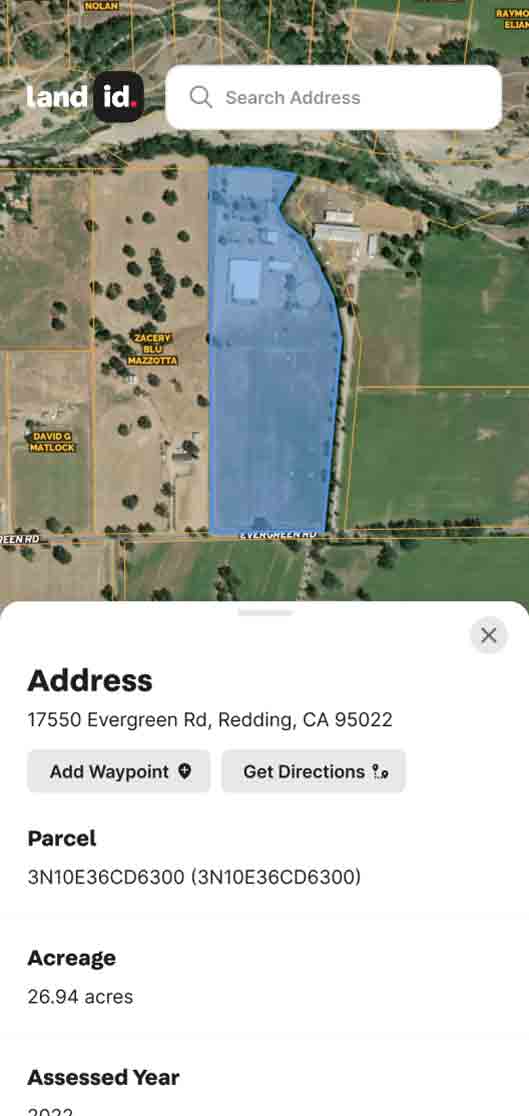
Finding GIS data can be time-consuming - and that’s assuming you’re able to find the right datasets in the first place. To make life a little easier, our platform offers consolidated data sources, ready to be added to your map as soon as you wish. These include FEMA’s digital Flood Insurance Rate Maps (DFIRMs), soil surveys, parcel and ownership information, city and county data, contour lines, and more. You even have the ability to build out custom proprietary geographic databases. Analyze anything from timber stands to comparable sales data or area coffee shops.
Whether you want to collect and analyze some GIS data yourself, pull in third-party data or utilize our GIS layers, Land id® (formerly MapRight) has all of the tools you need to gain a better understanding of the land. Ready to collect accurate, updated, and easy-to-use data? Sign up for your 7-day free trial of Land id®, and start building maps today!
FAQs
Continue Reading
Craig Rowe
How Factory-Built Housing Can Reshape America’s Housing Market
.png)
By Land id
The U.S. housing industry’s decade-plus-long inventory challenge could see its first true sign of resolution should the 21st Century Road to Housing Act become law.

Craig Rowe
Can Refurbishing Schools Help Solve Housing Issues?
By Land id
Old public schools are becoming apartments as enrollment drops. See why school-to-apartment conversion is adaptive reuse's fastest-growing niche.


Explore Private Parcel Data & Property Boundaries
Download the Land id app and try for free.