While the vast majority of Americans have access to high-speed internet, those living in rural areas fall far behind their urban counterparts. According to the FCC, 22.3% of Americans in rural areas and 27.7% of Americans in Tribal lands lack coverage from fixed terrestrial 25/3 Mbps broadband, as compared to only 1.5% of Americans in urban areas. This disparity has been especially pronounced since the pandemic drove many activities such as work, school, and medical care online.
Now, federal, state, and local governments are investing heavily in connectivity projects, but even with funding, laying down enough fiber optic cable to meet the needs of rural America is an uphill battle. With a tool like GIS, which integrates location data with descriptive information and allows governments and telecommunications companies to visualize the process, developing fiber-optic broadband doesn’t need to be a monumental feat.
Deploying a Fiber-Optic Broadband Network With GIS
Deploying and managing a broadband network requires a tremendous amount of location-based data which is just the type of data that GIS excels with. From planning and design to construction and managing operations, this technology is uniquely positioned to be a huge asset, all while helping to meet reporting requirements.
Design & Planning
In the initial phases of deployment, GIS plays a central role, laying the foundation and setting the project up for success. You need to have all the data, but you don’t want to become overwhelmed by it. By building a custom map containing all the spatial information you can get your hands on, you’re able to gain an understanding of the service area and build infrastructure more efficiently.
For instance, aerial photography of a service area may show larger features such as rivers or canyons that could impact the cost of the project, but this strategy misses less identifiable features such as wetlands. Fortunately, the US Fish and Wildlife Service maps wetlands across the country, and this data can easily be integrated into your GIS map, allowing you to view it alongside infrastructure, boundary lines, and other details.
Construction
Once a network design has been selected, the next step is to explore the most efficient methods for connecting each subscriber or part of the network together. GIS is incredibly beneficial during this phase, establishing clear, real-time data that helps stakeholders track progress and control costs.
GIS enables you to dive into data and analyze it at a granular level. This is especially important when you consider that the cost per foot to place fiber optic cable can be one of the most expensive costs of the entire project. By overlaying the roads and address points with incremental buffer zones representing the distance from roads, you’re able to estimate cable footage quickly and with greater accuracy.
Network Operations
After construction has been completed and the area is fully serviced with high-speed broadband, it’s still necessary to maintain the GIS map you used throughout the deployment process. Not only is all of the data related to design, planning, and construction preserved there, but as improvements are made, the map can be updated so it remains a central source of truth. If an interruption of service occurs, consulting your map will allow you to trace the problem back to the most likely location, so you know exactly your technicians need to go. And, when you want to expand service, you’ll be able to be as strategic as possible to keep costs down.
Bring Broadband to the People With GIS
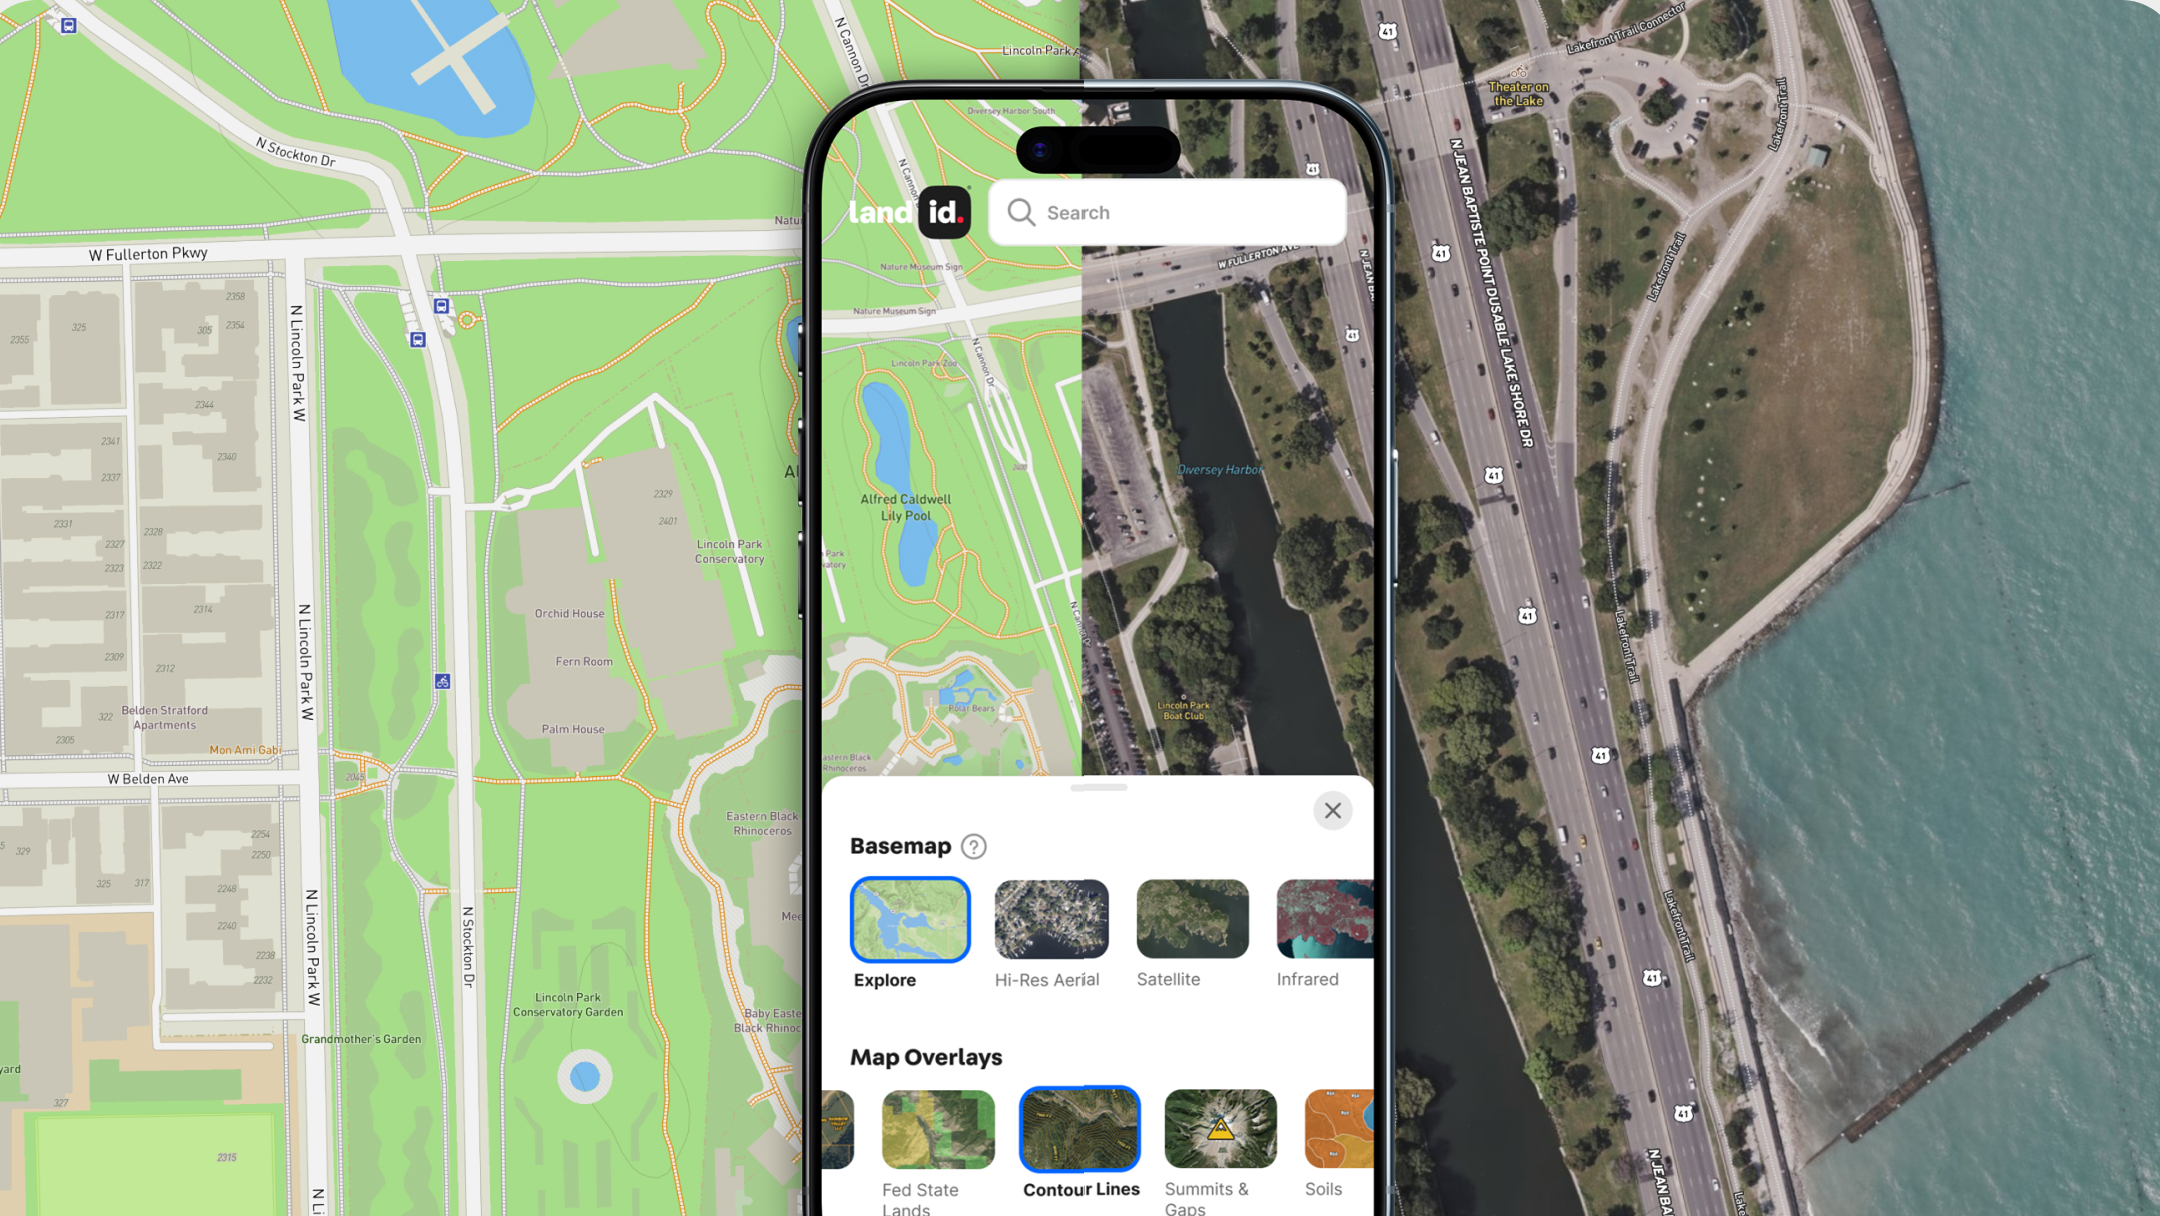
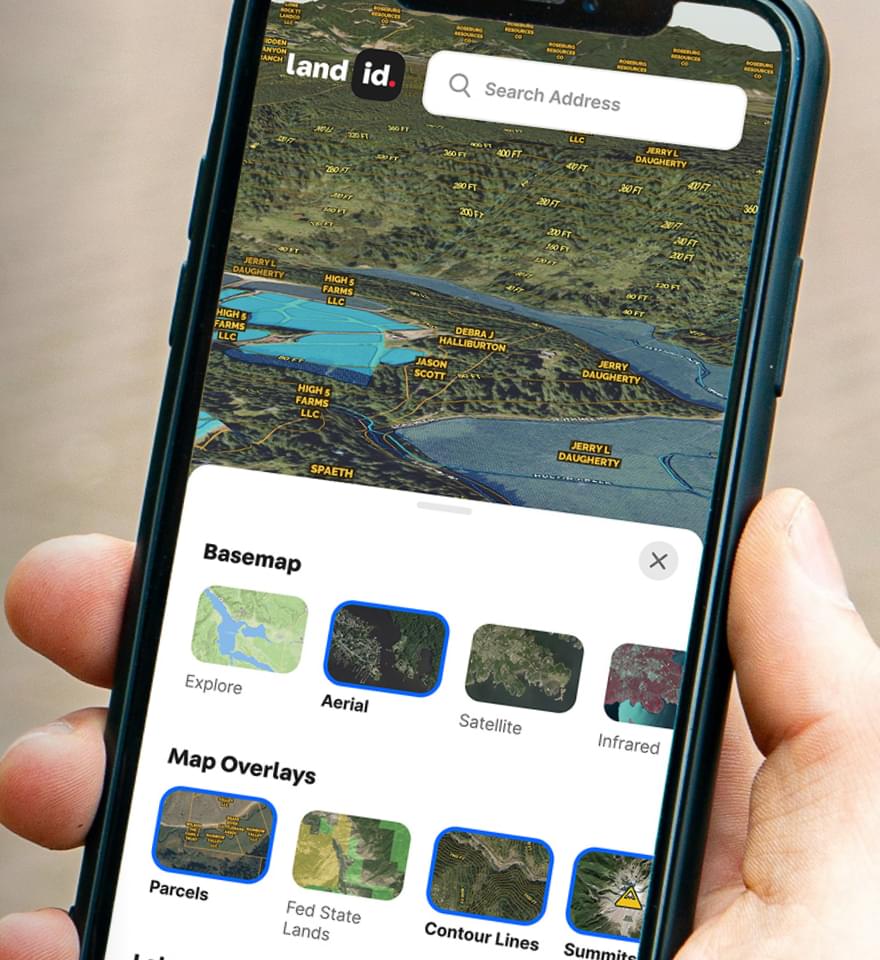
As governments and service providers across the country work to lay down fiber optic cable, GIS is proving to be a vital tool. At first glance, this technology may seem intimidating, but it doesn’t need to be. Land id® (formerly MapRight) has worked hard to create a mapping platform that professionals of all backgrounds can utilize to visualize and better understand their spatial data. With eight different base layers, nearly two dozen Land id® layers, and countless styling and customization options, your Land id® maps can be as simple or complex as your needs require. To see all the ways Land id® helps you access and manage data, sign up for a 7-day free trial, and start building your first map in minutes.
FAQs
Continue Reading

