Geographic Information Systems (GIS) give us the power to map, measure, and understand the world with remarkable precision. At their core, GIS datasets describe not just what a feature is, but exactly where it exists. That location awareness opens the door to everything from environmental modeling to parcel mapping.
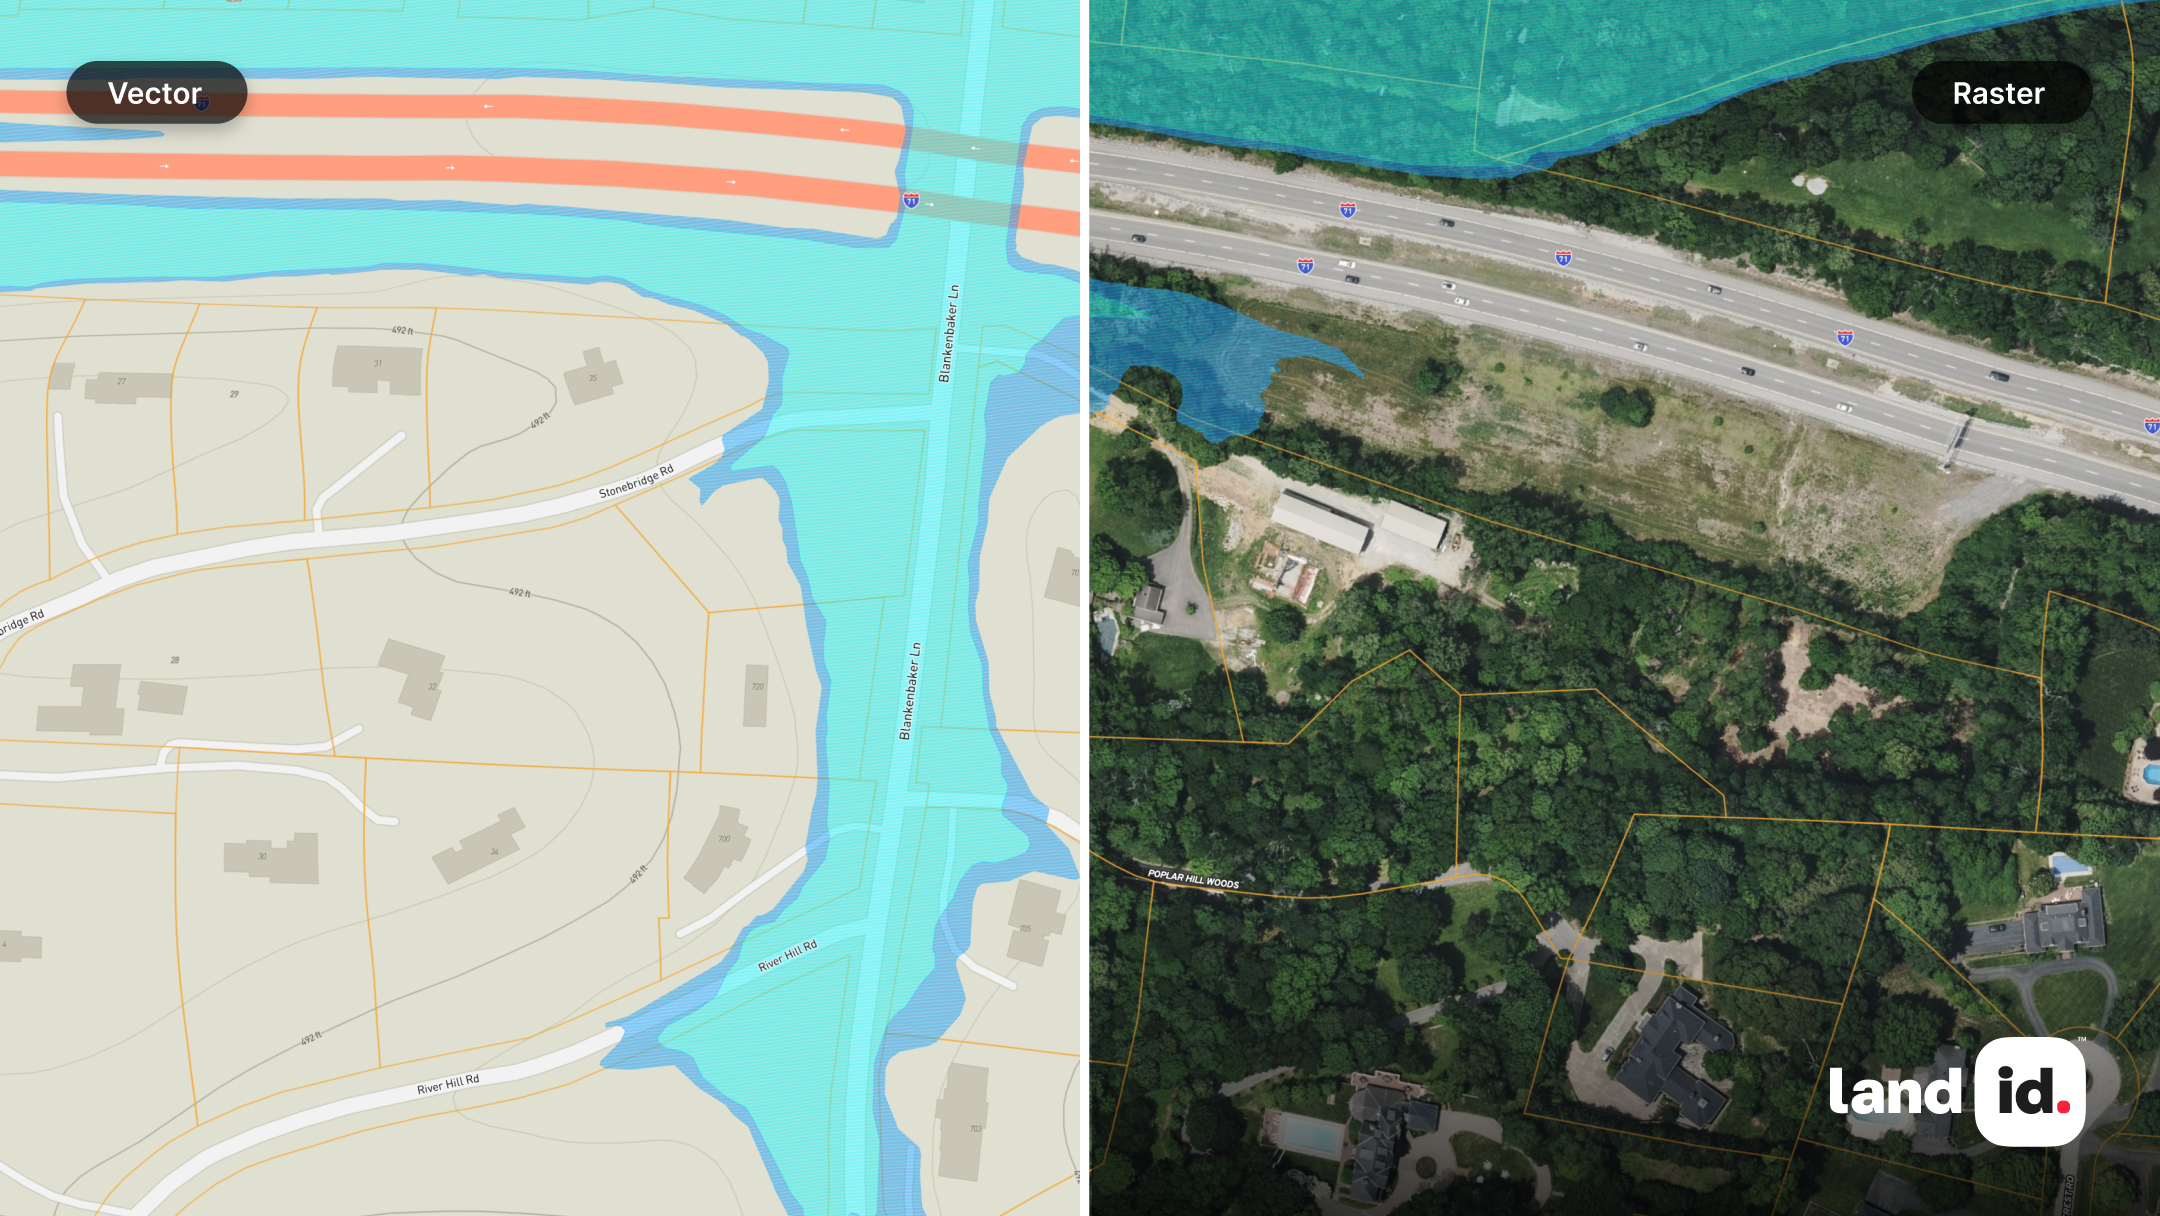
GIS handles two main types of data: attribute data, neatly organized in tables, and geospatial data, which are represented as one of two main graphic data types: raster and vector.
In this article, we will break down the differences between raster and vector data and look at their advantages and practical applications, helping you make informed decisions for your GIS projects.
Main Takeaways
- Raster data uses a grid of cells to represent primarily continuous information, such as elevation, temperature, or satellite imagery.
- Vector data uses points, lines, and polygons to represent individual features such as roads, buildings, or boundaries.
- Whether you choose raster vs. vector data depends on the nature of your project, desired level of detail, scalability needs, and storage constraints.
- Understanding how raster and vector formats convert into one another (and where conversions fall short) helps you manage data more effectively.
- Land id incorporates both raster and vector formats so you can map with accuracy.
What Is Raster Data?
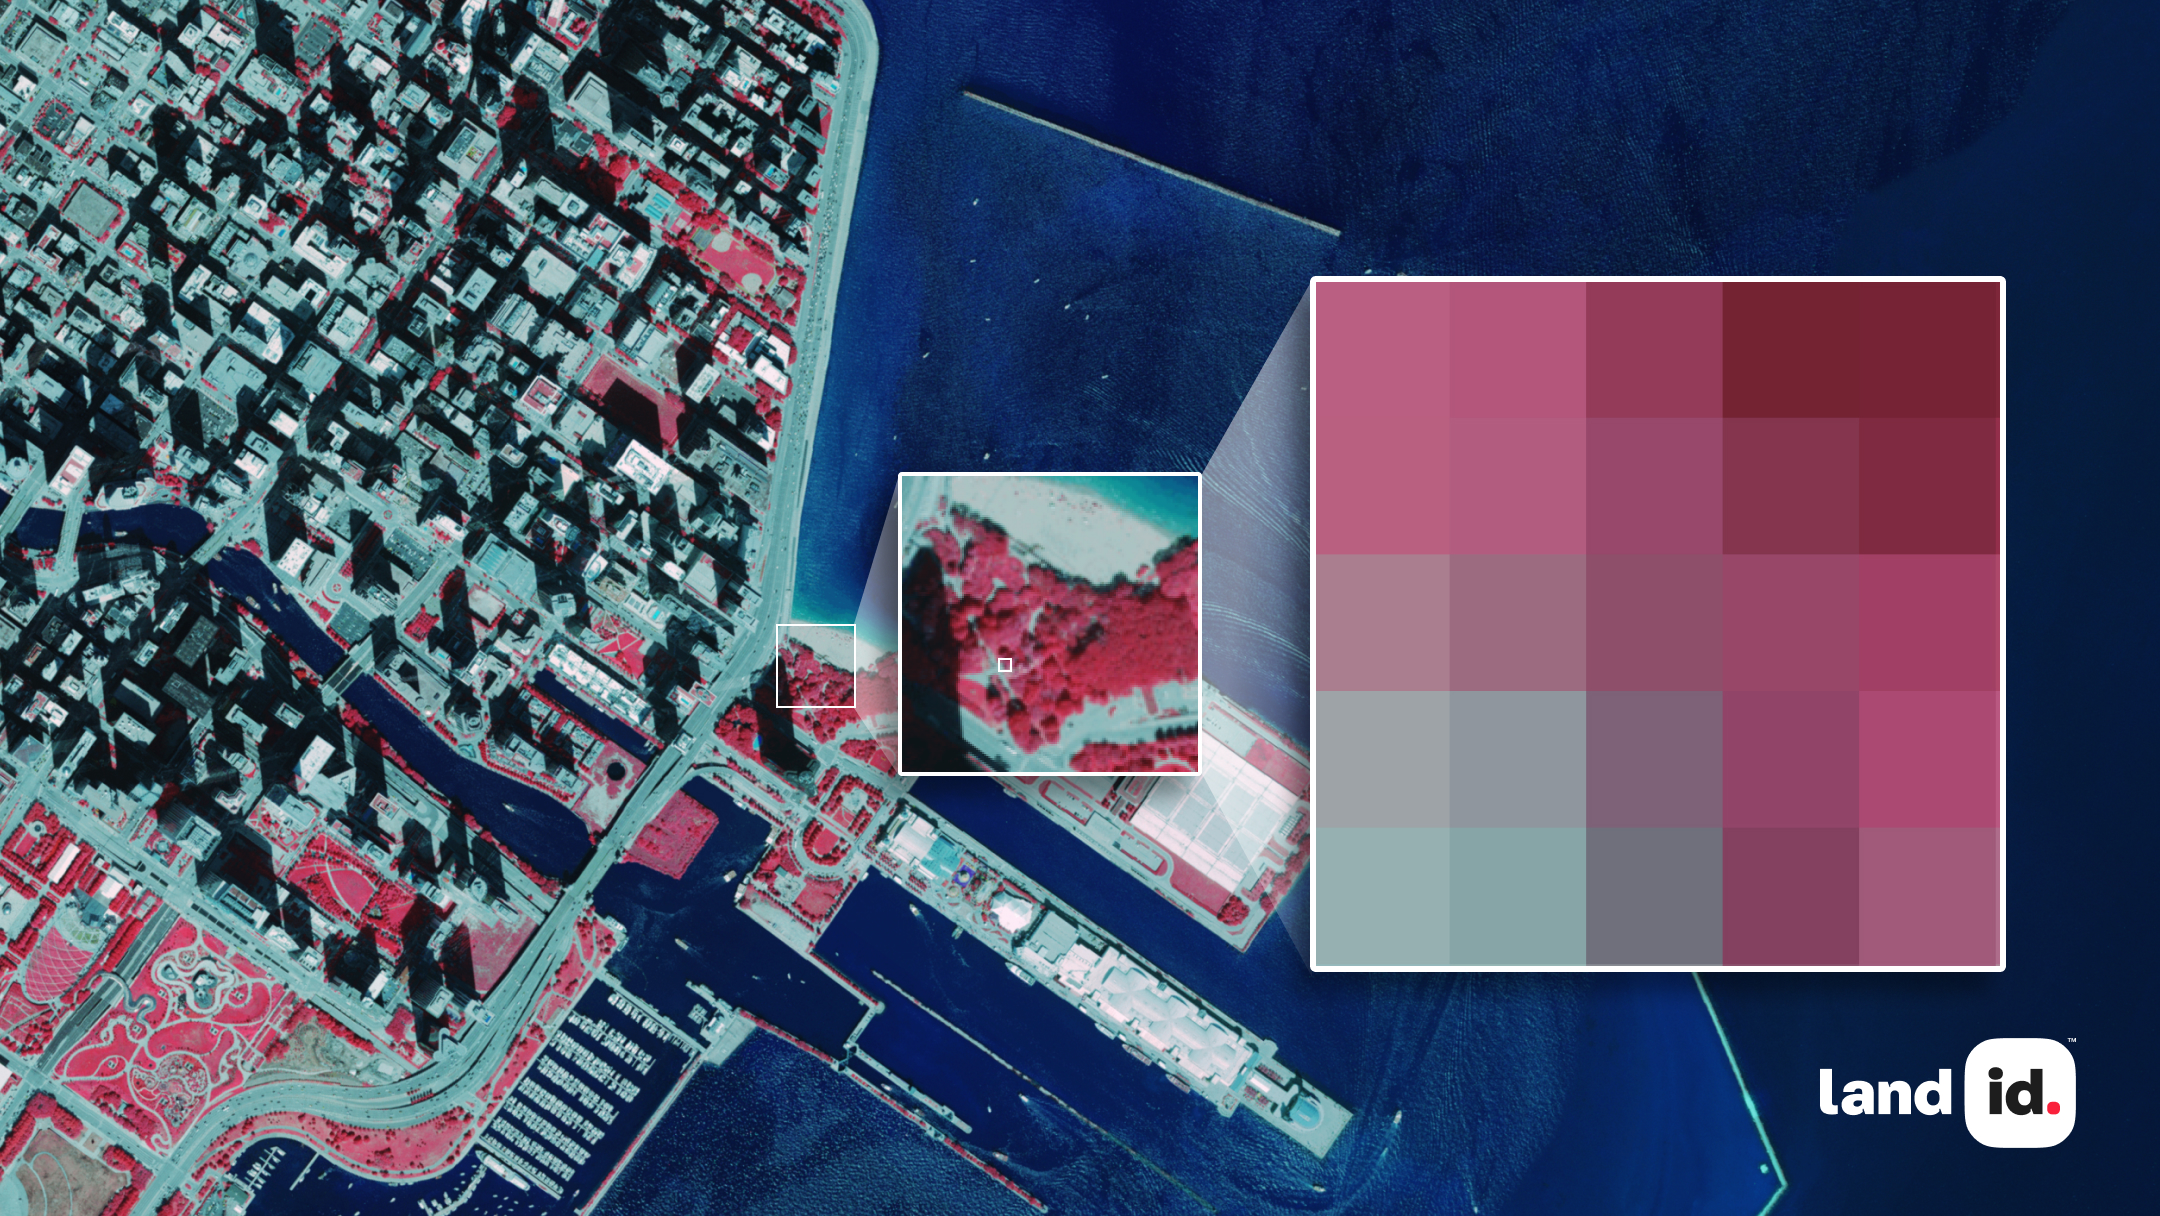
Raster data is built from a grid of uniformly sized pixels arranged in rows and columns. Each pixel contains a value representing a specific attribute. In a photograph, that value might be a combination of red, green, and blue. In GIS datasets, it could represent rainfall averages, elevation, soil pH, vegetation density, or atmospheric CO₂ levels.
Because every pixel is the same size and shape, raster data provides a consistent representation of the surface. Raster image resolution determines how detailed that representation is. Higher resolution means smaller pixels and more detail, while lower resolution uses larger pixels and simplifies the landscape. Satellite imagery that assigns one pixel per 30-by-30 meter area is a common example.
Common Use Cases for Raster Data
- Environmental science for modeling climate patterns or monitoring deforestation
- Urban planning for evaluating land use and development patterns
- Agriculture for precision farming, crop monitoring, and soil assessment
Whenever your goal involves continuous surfaces or gradually changing values, raster data will likely be your best fit.
What Is Vector Data?
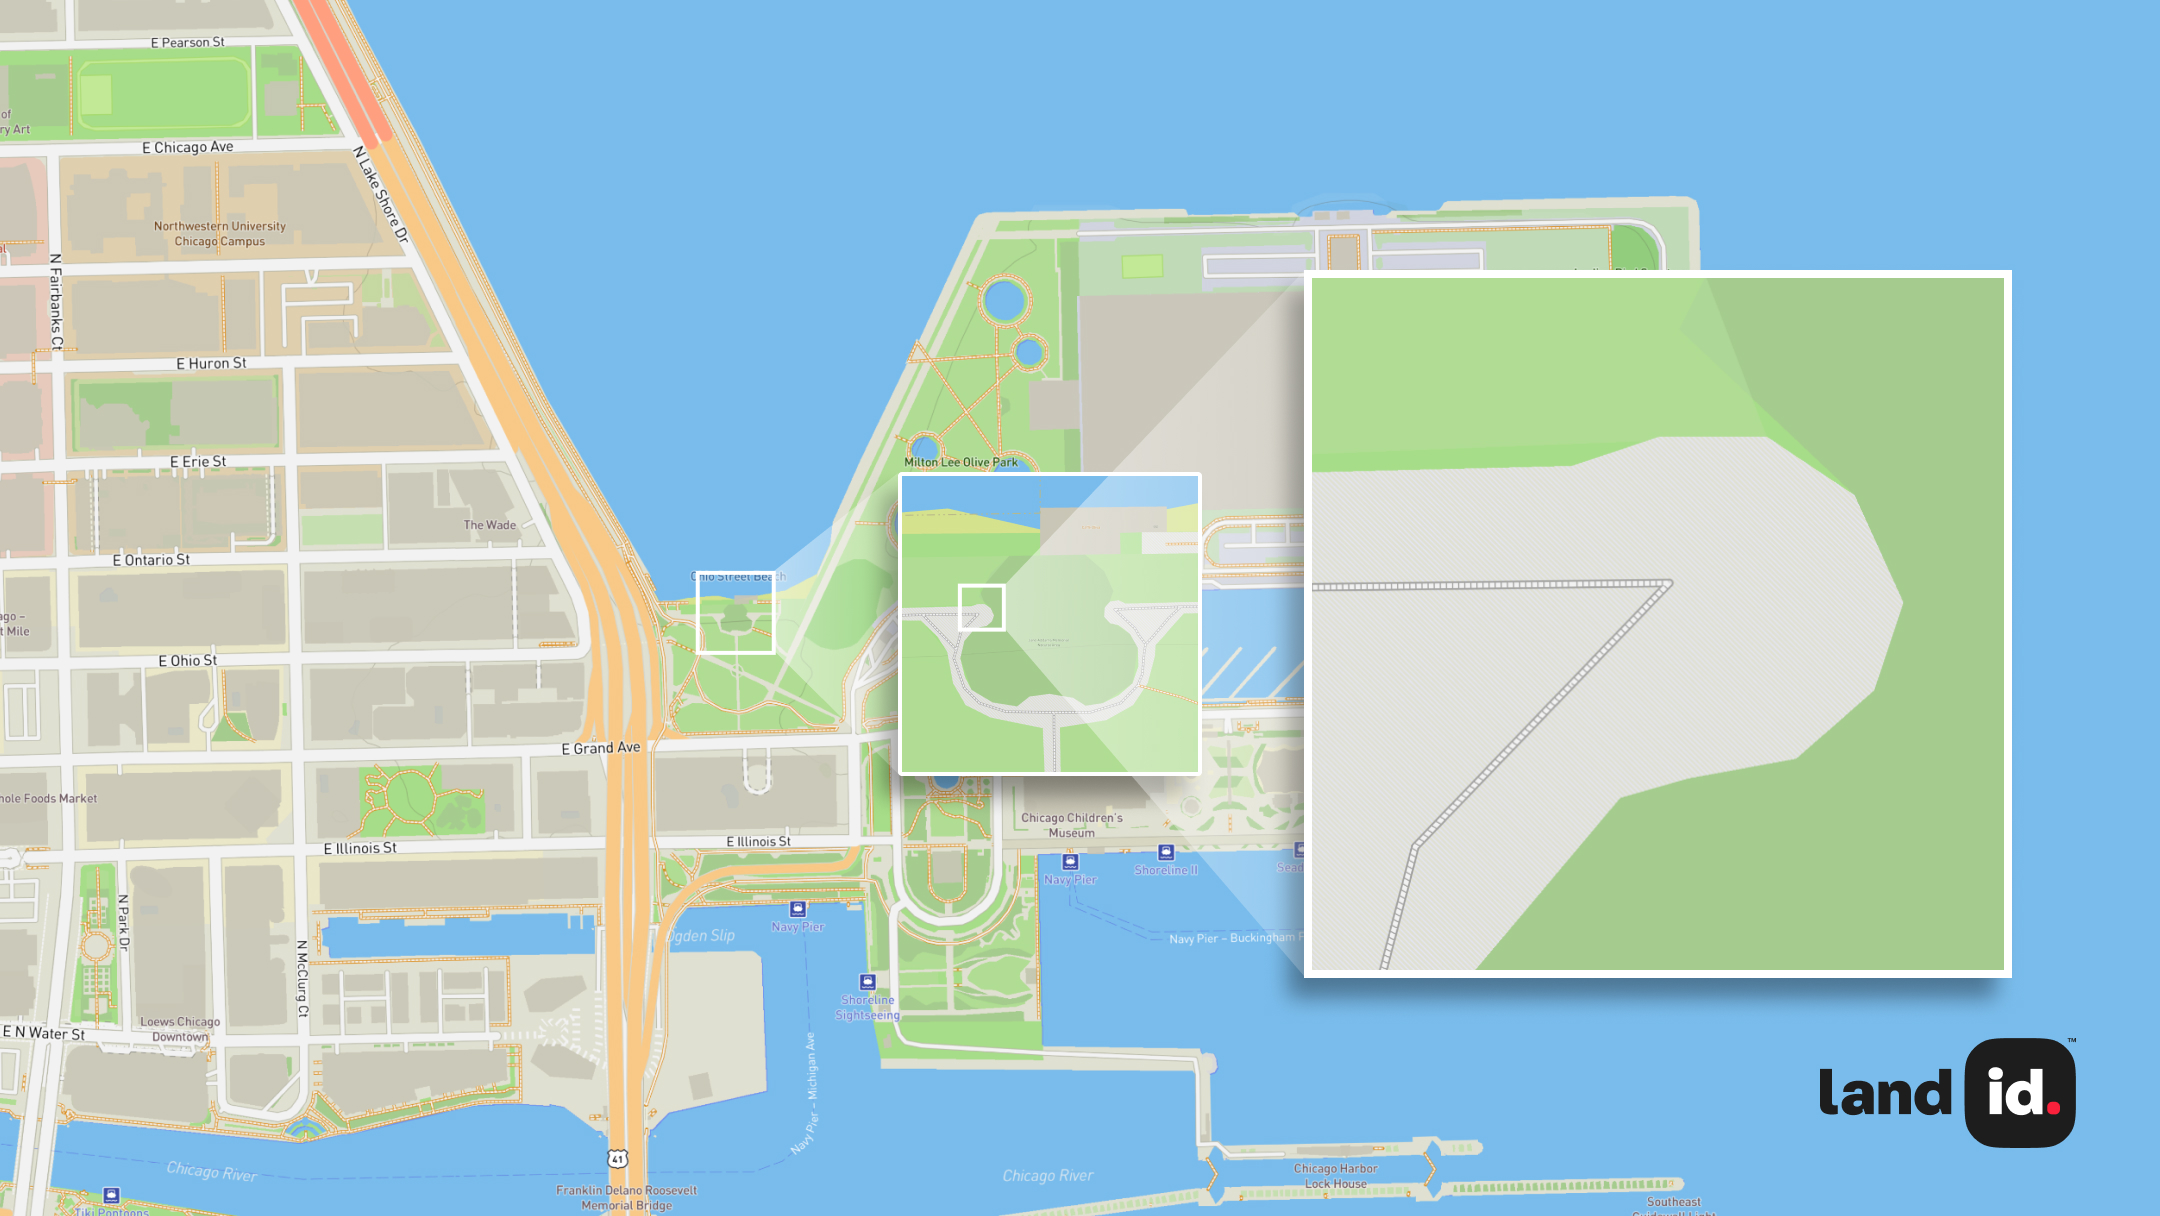
Vector datasets describe geographic features using three geometric building blocks: points, lines, and polygons.
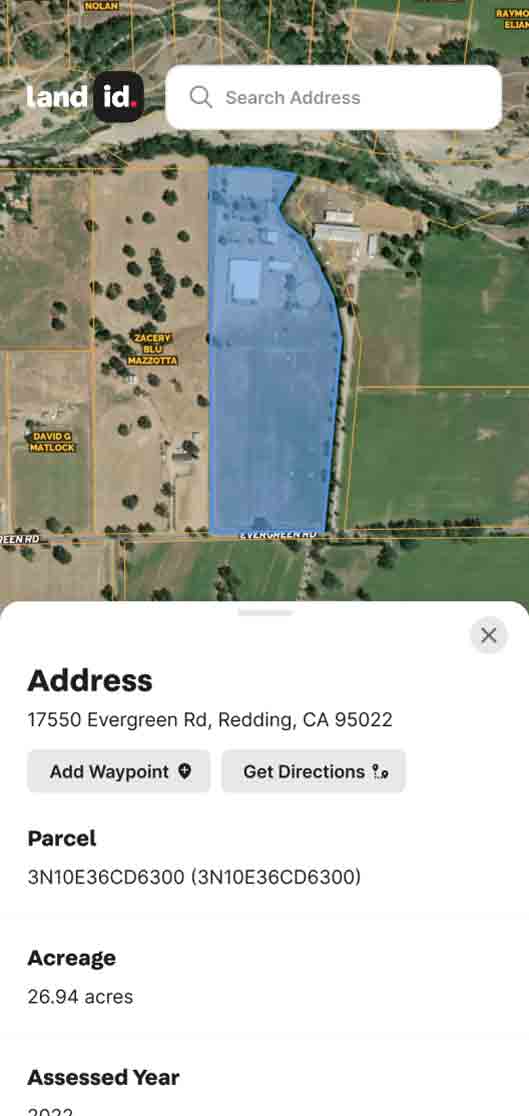
- Points mark precise XY locations, ideal for features too small to display as areas, such as wells, trees, or individual buildings.
- Lines represent linear features including roads, pipelines, rivers, and trails. Their defined start and endpoints make it possible to measure length and direction.
- Polygons define the boundaries and area of features like lakes, parcels, city limits, or buildings.
Vector data excels when accuracy, crisp boundaries, and visual clarity are priorities. It’s widely used for navigation systems, utility networks, zoning maps, and any application where exact measurements matter.
Advantages of Raster Models
Raster data offers several strengths that make it indispensable for analytical work:
- Continuous data representation. Its grid structure is ideal for continuous surfaces, enabling smooth transitions and realistic modeling.
- Simplicity. The format is straightforward to create, store, and manipulate, even during complex analytical operations.
- Compatibility with remote sensing. Most satellite and aerial data is inherently raster-based, making integration seamless.
- Efficient processing. Uniform cell sizes allow for fast calculations, map algebra, hydrological modeling, and other spatial analyses.
- High-resolution detail. Very small cell sizes capture fine patterns that vector data cannot represent as naturally.
Disadvantages of Raster Models
Raster’s grid-based nature also creates challenges:
- Large file sizes. High-resolution datasets can grow quickly, increasing storage and processing demands.
- Resolution dependency. Detail is tied directly to pixel size. Higher accuracy means larger files.
- Lower precision for boundaries. Fine edges and small-scale features can appear blocky.
- Complex calculations. While raster images support powerful analyses, some operations can be computationally intensive.
- Fixed cell structure. Complex shapes may be generalized or simplified unintentionally.
Advantages of Vector Data
Vector data shines whenever accuracy and structure are crucial:
- Precision. Points, lines, and polygons capture exact shapes and boundaries with remarkable clarity.
- Scalability. Vector features remain sharp at any zoom level, free of pixelation.
- Smaller file sizes. Especially for sparse or linear features, vectors store information efficiently.
- Easy editing. Individual features can be adjusted without affecting surrounding geometry.
- Rich attribute integration. Each feature can hold extensive descriptive information.
- Topological relationships. Vectors support connections, adjacency, and network behavior, which is essential for routing, utility modeling, and transportation planning.
Disadvantages of Vector Data
Even with their strengths, vectors come with limitations:
- Complex structures. Large or intricate datasets can be more challenging to create and manage.
- Higher cost. Collecting and maintaining detailed vector data often requires specialized equipment or manual editing.
- Poor representation of continuous surfaces. Phenomena like temperature gradients or elevation changes are harder to model accurately.
- Performance issues. Very large datasets may slow processing.
- Time-consuming editing. Adjusting intricate geometries can require careful, deliberate work.
Raster vs. Vector Data: Key Differences
Choosing between raster and vector data depends on what you need your map to do. Here’s how they compare.
Data Structure
- Raster: Information is arranged in a grid, with each cell storing a single value.
- Vector: Features are defined by coordinates rather than a grid.
Representation
- Raster: Ideal for continuous data and gradual transitions.
- Vector: Best for discrete features with exact shapes and sharp boundaries.
Detail & Scalability
- Raster: More resolution means more detail, but zooming in can reveal pixelation.
- Vector: Maintains precision at any scale, making it excellent for detailed mapping.
Storage
- Raster: Large file sizes, especially at high resolution.
- Vector: Typically smaller and more efficient for discrete features.
Analysis
- Raster: Excels at spatial modeling, overlays, and environmental analysis.
- Vector: Strong for network analysis, measurements, and relational mapping.
Attributes
- Raster: One value per pixel, which limits complexity.
- Vector: Features can store extensive descriptive information.
Editing
- Raster: Pixel-level edits can have ripple effects.
- Vector: Localized edits make updates more flexible and controlled.
Raster or Vector: Which Should You Use?
As a general rule of thumb, raster images are best for high-quality, detailed artwork such as photographs. Vector data is ideal for work that needs to be scaled or used across various product types and sizes.
Which you choose—raster or vector data—comes down to several practical considerations:
- Type of data
- Use vector for discrete features with clear boundaries.
- Use raster for continuous surfaces or gradual changes.
- Scalability needs. Vectors remain sharp at any zoom level. Rasters may blur or pixelate when magnified.
- Analysis requirements. Raster grids support powerful modeling and overlay operations. Vector formats excel for measurements, routes, and connectivity.
- Project goals. If you need exact shapes and boundaries, opt for vector datasets. If you’re visualizing broad patterns or environmental conditions, a raster surface may offer more insight.
- Ease of editing. Vector data offers simpler, more targeted editing. Rasters require more care due to their interconnected cells.
- Storage. Vector files are generally smaller. High-resolution rasters can be significantly larger.
Many projects benefit from using both formats together, drawing on the strengths of each.
Converting Between Raster & Vector Formats
GIS software can convert between raster and vector formats, but these conversions have trade-offs.
- Raster-to-vector workflows may lose detail or produce simplified shapes.
- Vector-to-raster conversions can introduce artificial boundaries or reduce precision.
Understanding these limitations helps ensure that you preserve the quality and intent of your data.
Working With Raster & Vector Data in Land id
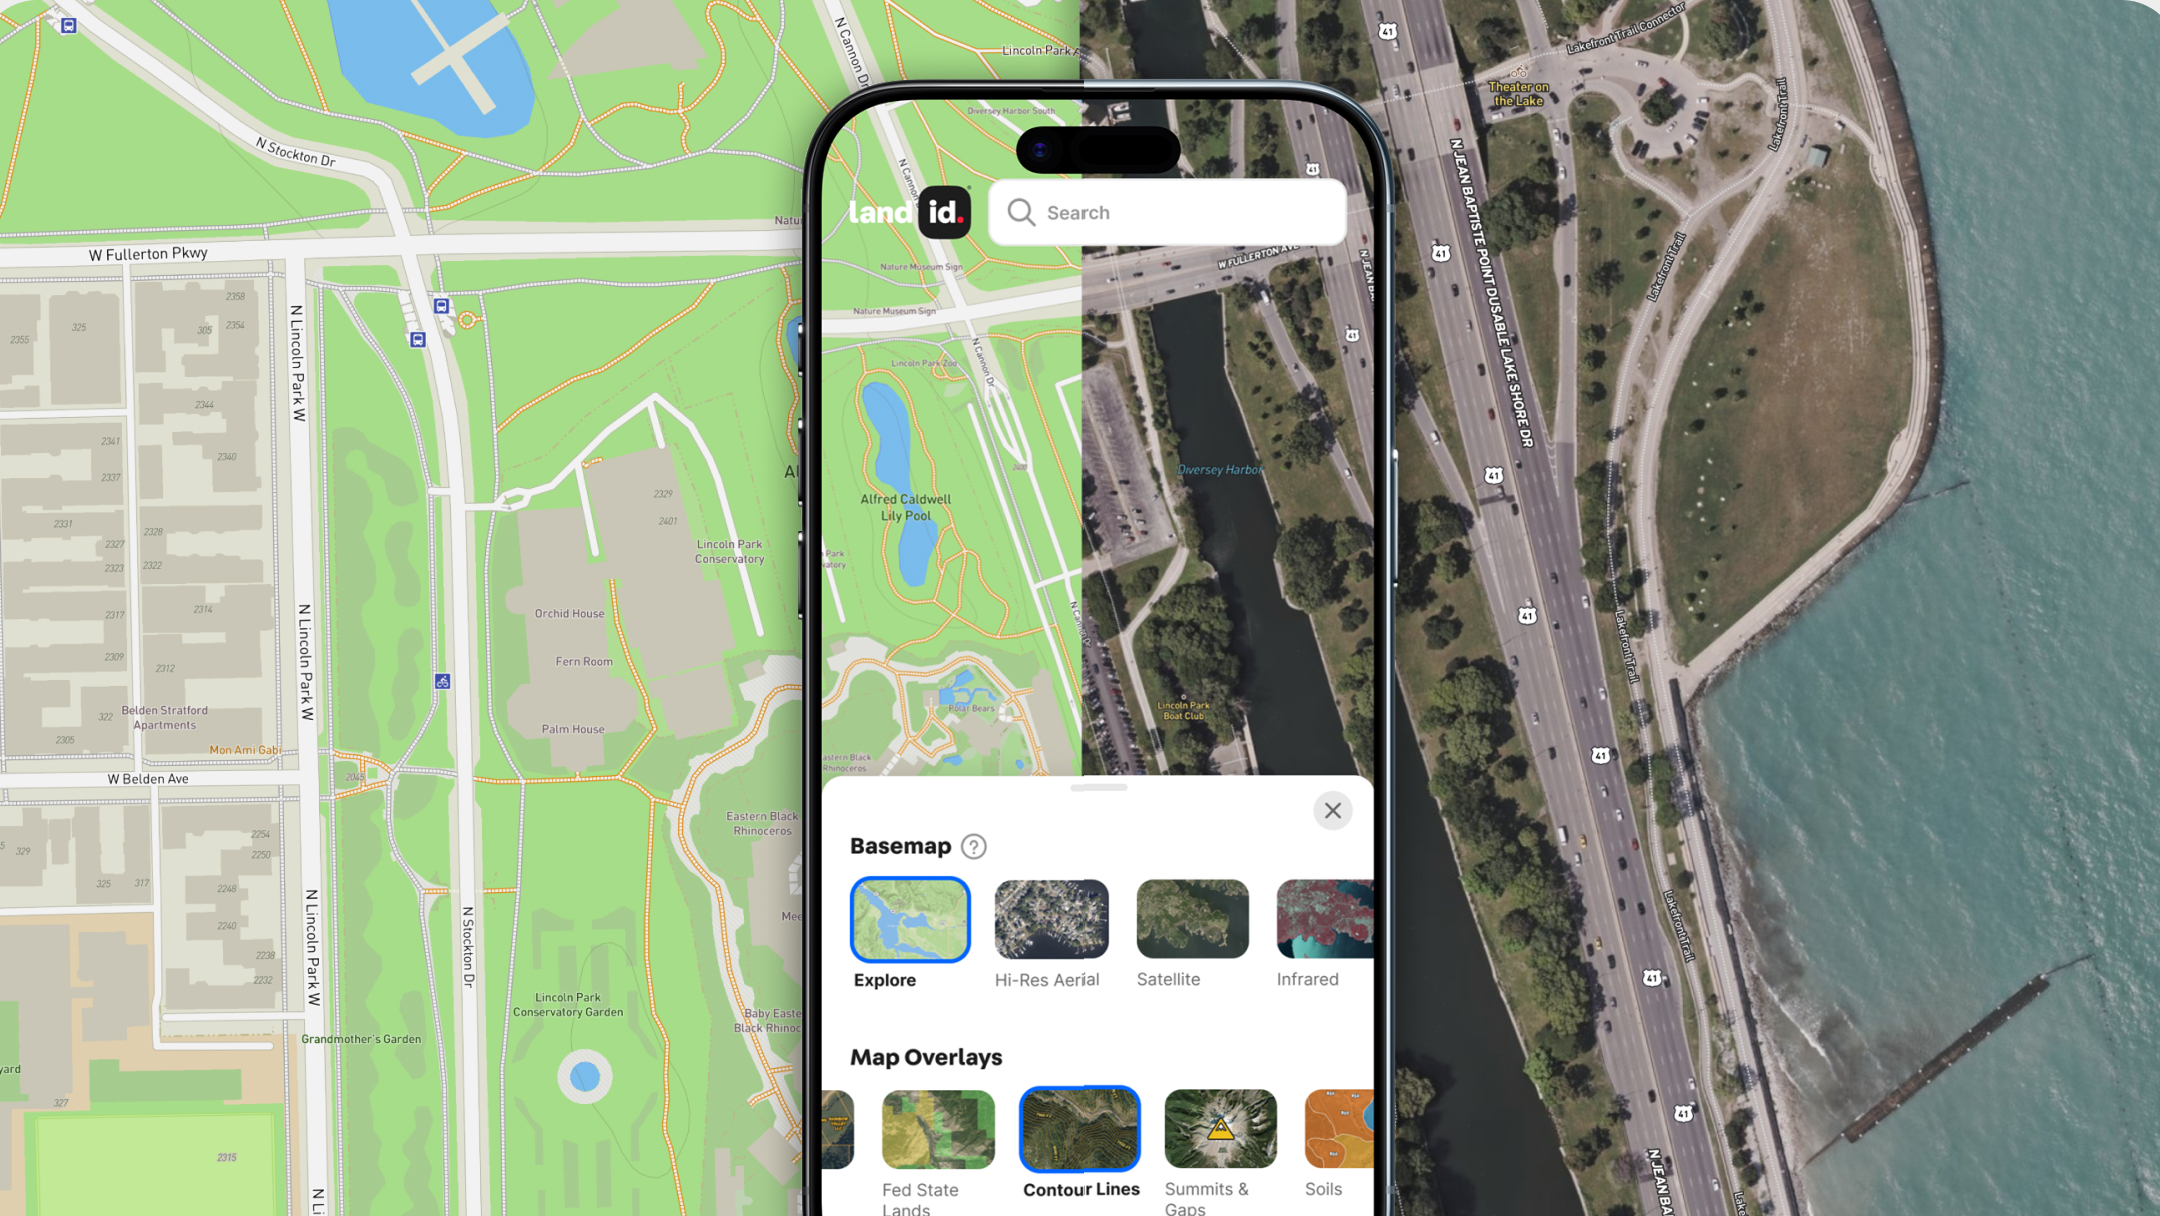
Land id gives you a flexible environment for working with both data types, whether you're mapping thousands of acres or highlighting a single property.
With Land id, you can choose from seven customizable base layers and toggle more than 40 preloaded GIS layers. You can also import geographic files into your map to breathe new life into existing data.
Once your data is in place, Land id makes it simple to style, label, visualize, and share your work. Automatic labeling improves clarity. Intuitive icons and color tools help differentiate features. Customizable layer controls let you focus on what matters most.
Because Land id is designed for experts and beginners alike, you can build polished, professional maps without needing a traditional GIS background. Land id handles the complexity so you can stay focused on the insights.
FAQs
Continue Reading
How Land id Works for Residential Agents
By Land id
Learn how Land id helps residential real estate agents visualize location, uncover property context, and market listings with greater impact.

Craig Rowe
Can Refurbishing Schools Help Solve Housing Issues?
.png)
By Land id
Old public schools are becoming apartments as enrollment drops. See why school-to-apartment conversion is adaptive reuse's fastest-growing niche.

Explore Private Parcel Data & Property Boundaries
Download the Land id app and try for free.